
Bitcoin is Suspiciously Boring. That Often Doesn't Bode Well
Bitcoin is currently moving in a narrow range and is not reacting to turbulent geopolitical events or macro data. However, history teaches that periods of low volatility are often followed by sharp price movements. What does the growing interest in derivatives suggest, and where will the exchange rate head next week?
Bitcoin's price action has been incredibly boring lately. It reacts only slightly to macroeconomic events and mostly moves sideways at night. Historically, however, we know that such periods precede a stronger move. Furthermore, interest in cryptocurrency derivatives is growing significantly. Where could the price move next week? We will try to find the answer.
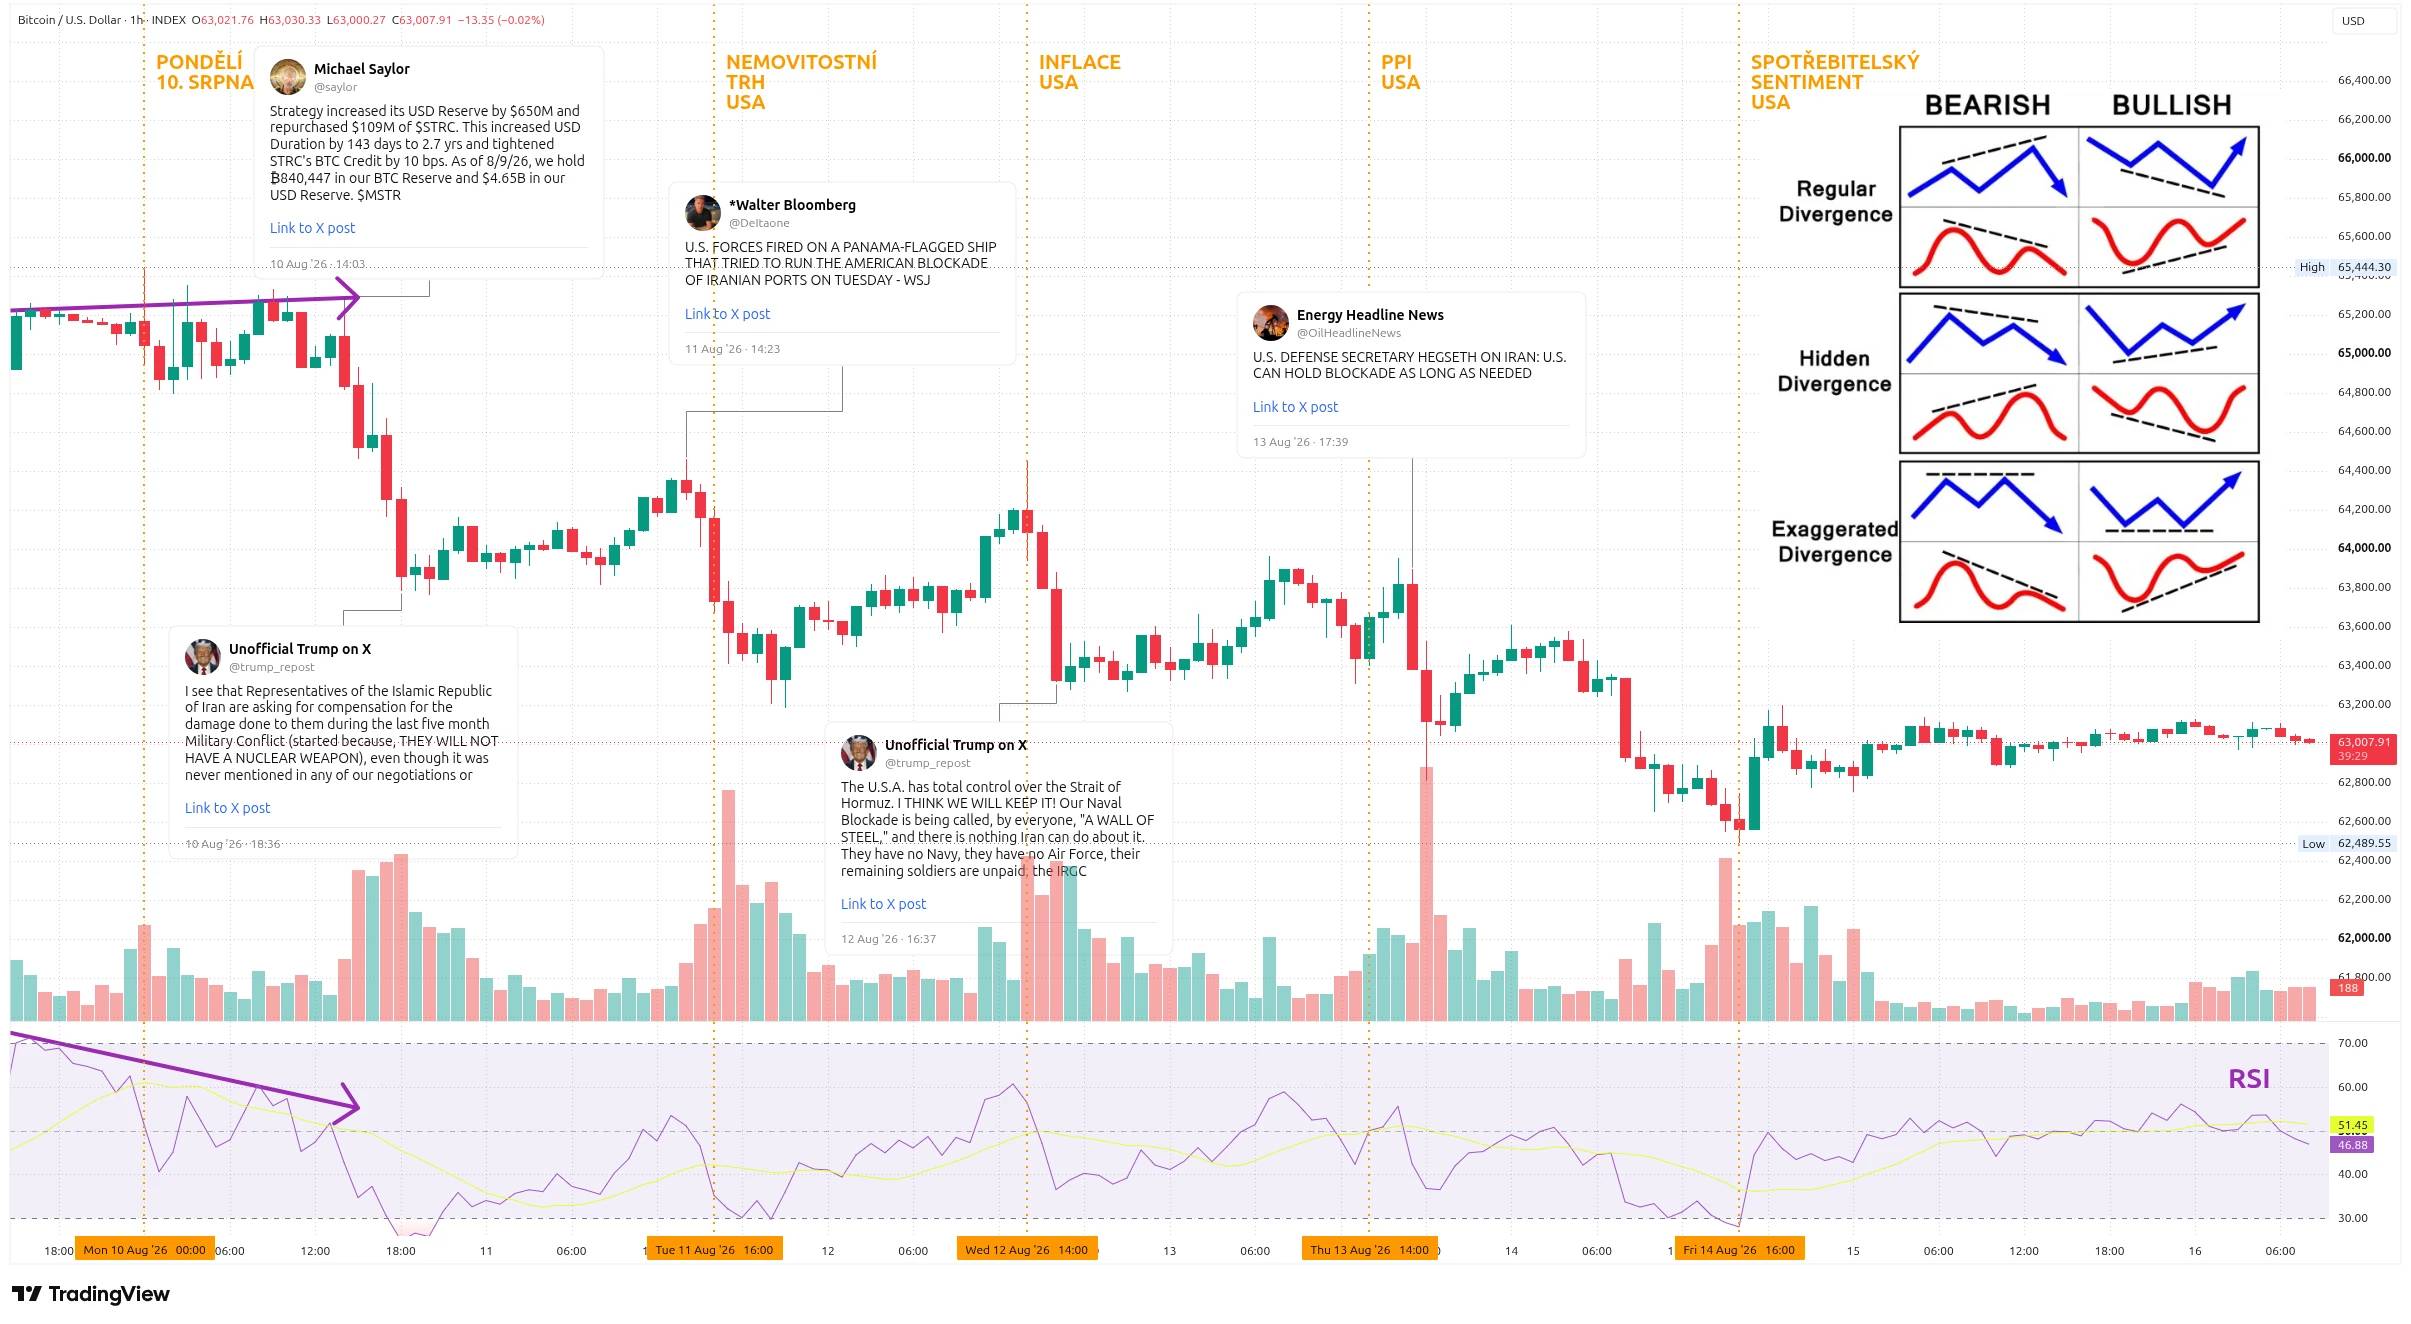
As usual, we will first analyze the current week on the hourly chart. It is the best way to track various macroeconomic events and their impact on the price of Bitcoin. And this week, it started as early as Sunday afternoon.
The price of Bitcoin got above $65,300. This tested the resistance we identified last Sunday on the daily chart. The Relative Strength Index (RSI) reached a value of around 72 points, which is quite unusual for a Sunday.
Then came a sideways movement that carried over into the new week. While the price went sideways, we see a gradual decline in the RSI. This bearish divergence signaled a possible further drop. We just needed an impulse.
That came after 2 PM. This is the time MicroStrategy usually announces its activities for the past week. While a week ago their Bitcoin purchase pushed us up, this week the markets evaluated it negatively.
Shortly after the announcement, the price of Bitcoin began to fall and by around 5 PM it was already trading around $63,900. The RSI at that time reached the oversold zone (below 30 points), signaling a possible reversal. In this case, however, it was not a rally, but only a sideways movement.
Iran and the US demand compensation for the conflict
Markets may have slowed down in an attempt to understand Donald Trump's statements. He decided to demand compensation from Iran for damages incurred not only in the current conflict, but his list was overall quite extensive. Markets were likely trying to figure out if such a thing was even realistic and waiting for the other side's reaction.
So we entered Tuesday again with a sideways movement, which gave the RSI room for a slow return to the center area. After 2 PM, the price of Bitcoin was moving around $64,400 and the RSI was at 50 points. But then came news of an attack in the Strait of Hormuz.
The United States opened fire on a Panama-flagged ship that attempted to pass through their blockade of Iranian ports. Added to this were reports on the state of the US real estate market. Sales of older homes continue to fall, representing another signal of a potential problem for the US economy.
However, Bitcoin's decline was not significant. It stopped in the $63,300 area. The price then transitioned into a sideways movement, which it also entered on Wednesday. It's starting to become a rule. It looked like markets would wait for the afternoon announcement of the inflation rate in the United States.
In the end, someone couldn't wait. A few hours before the announcement, a rally occurred and at the time of the announcement, the price of Bitcoin was attacking $64,400. However, inflation did not surprise. Both core and headline inflation met analysts' expectations from both a monthly and annual perspective, so the rally very quickly turned into a decline.
Within two hours, the price returned to $63,300. The RSI gave us room for a further decline, but for a change, a message came from the US President: they fully control the Strait of Hormuz, Iran can do nothing about it, and their "Steel Wall" (as everyone supposedly calls their blockade) is indestructible.
Bitcoin stops reacting strongly to Trump's statements
We see that the markets have already become relatively used to this news, so instead of further growth or decline, a sideways movement came for a change. Someone should verify this information from Trump immediately. Perhaps, however, it is part of a paid feature that Donald Trump has started offering on his social network.
So we entered Thursday again with a sideways movement and eventually started to grow slightly. The price reached $63,900 and then a decline followed. We were briefly pulled out of it by the release of producer inflation in the US. Or rather, the volatility around unmet expectations. Analysts expected an increase of 0.2%, but reality remained unchanged.
The increased volatility lasted only a few hours. Defense Secretary Hegseth made it known that they can maintain the blockade of the Strait of Hormuz indefinitely. That sounds determined, but shortly thereafter there was an attack on two vessels under the flag of the United Arab Emirates, which blames Iran for the attack.
The price of Bitcoin then very quickly returned to its original downward trajectory and took liquidity at the $62,800 level. This pushed us back to $63,400, where we again continued to move sideways and slowly carried over into Friday morning.
Words are cheap and ships continue to be attacked
However, Asian markets slowly started to push us down. Information regarding the evening attack on the vessels was not positive and could be attributed to the Friday drops. At the time the New York Stock Exchange opened, the price of Bitcoin was moving around $62,500, which defined the current weekly low.
A slight recovery occurred only after the release of US consumer sentiment. This survey is conducted by the University of Michigan, and a value above 50 points indicates a positive mood, while below 50 points is negative. Instead of the expected 54.5 points, the value came out at 51 points. We are thus balancing on the edge of falling into a negative outlook.
Paradoxically, worse consumer sentiment managed to return us above $63,000. Subsequently, however, we switched to a sideways movement and the price held around this level not only all Friday night, but also most of Saturday. Despite growing volumes from tonight, the price is currently holding in the $63,000 area.
Four-hour chart predicts a return to $64,450
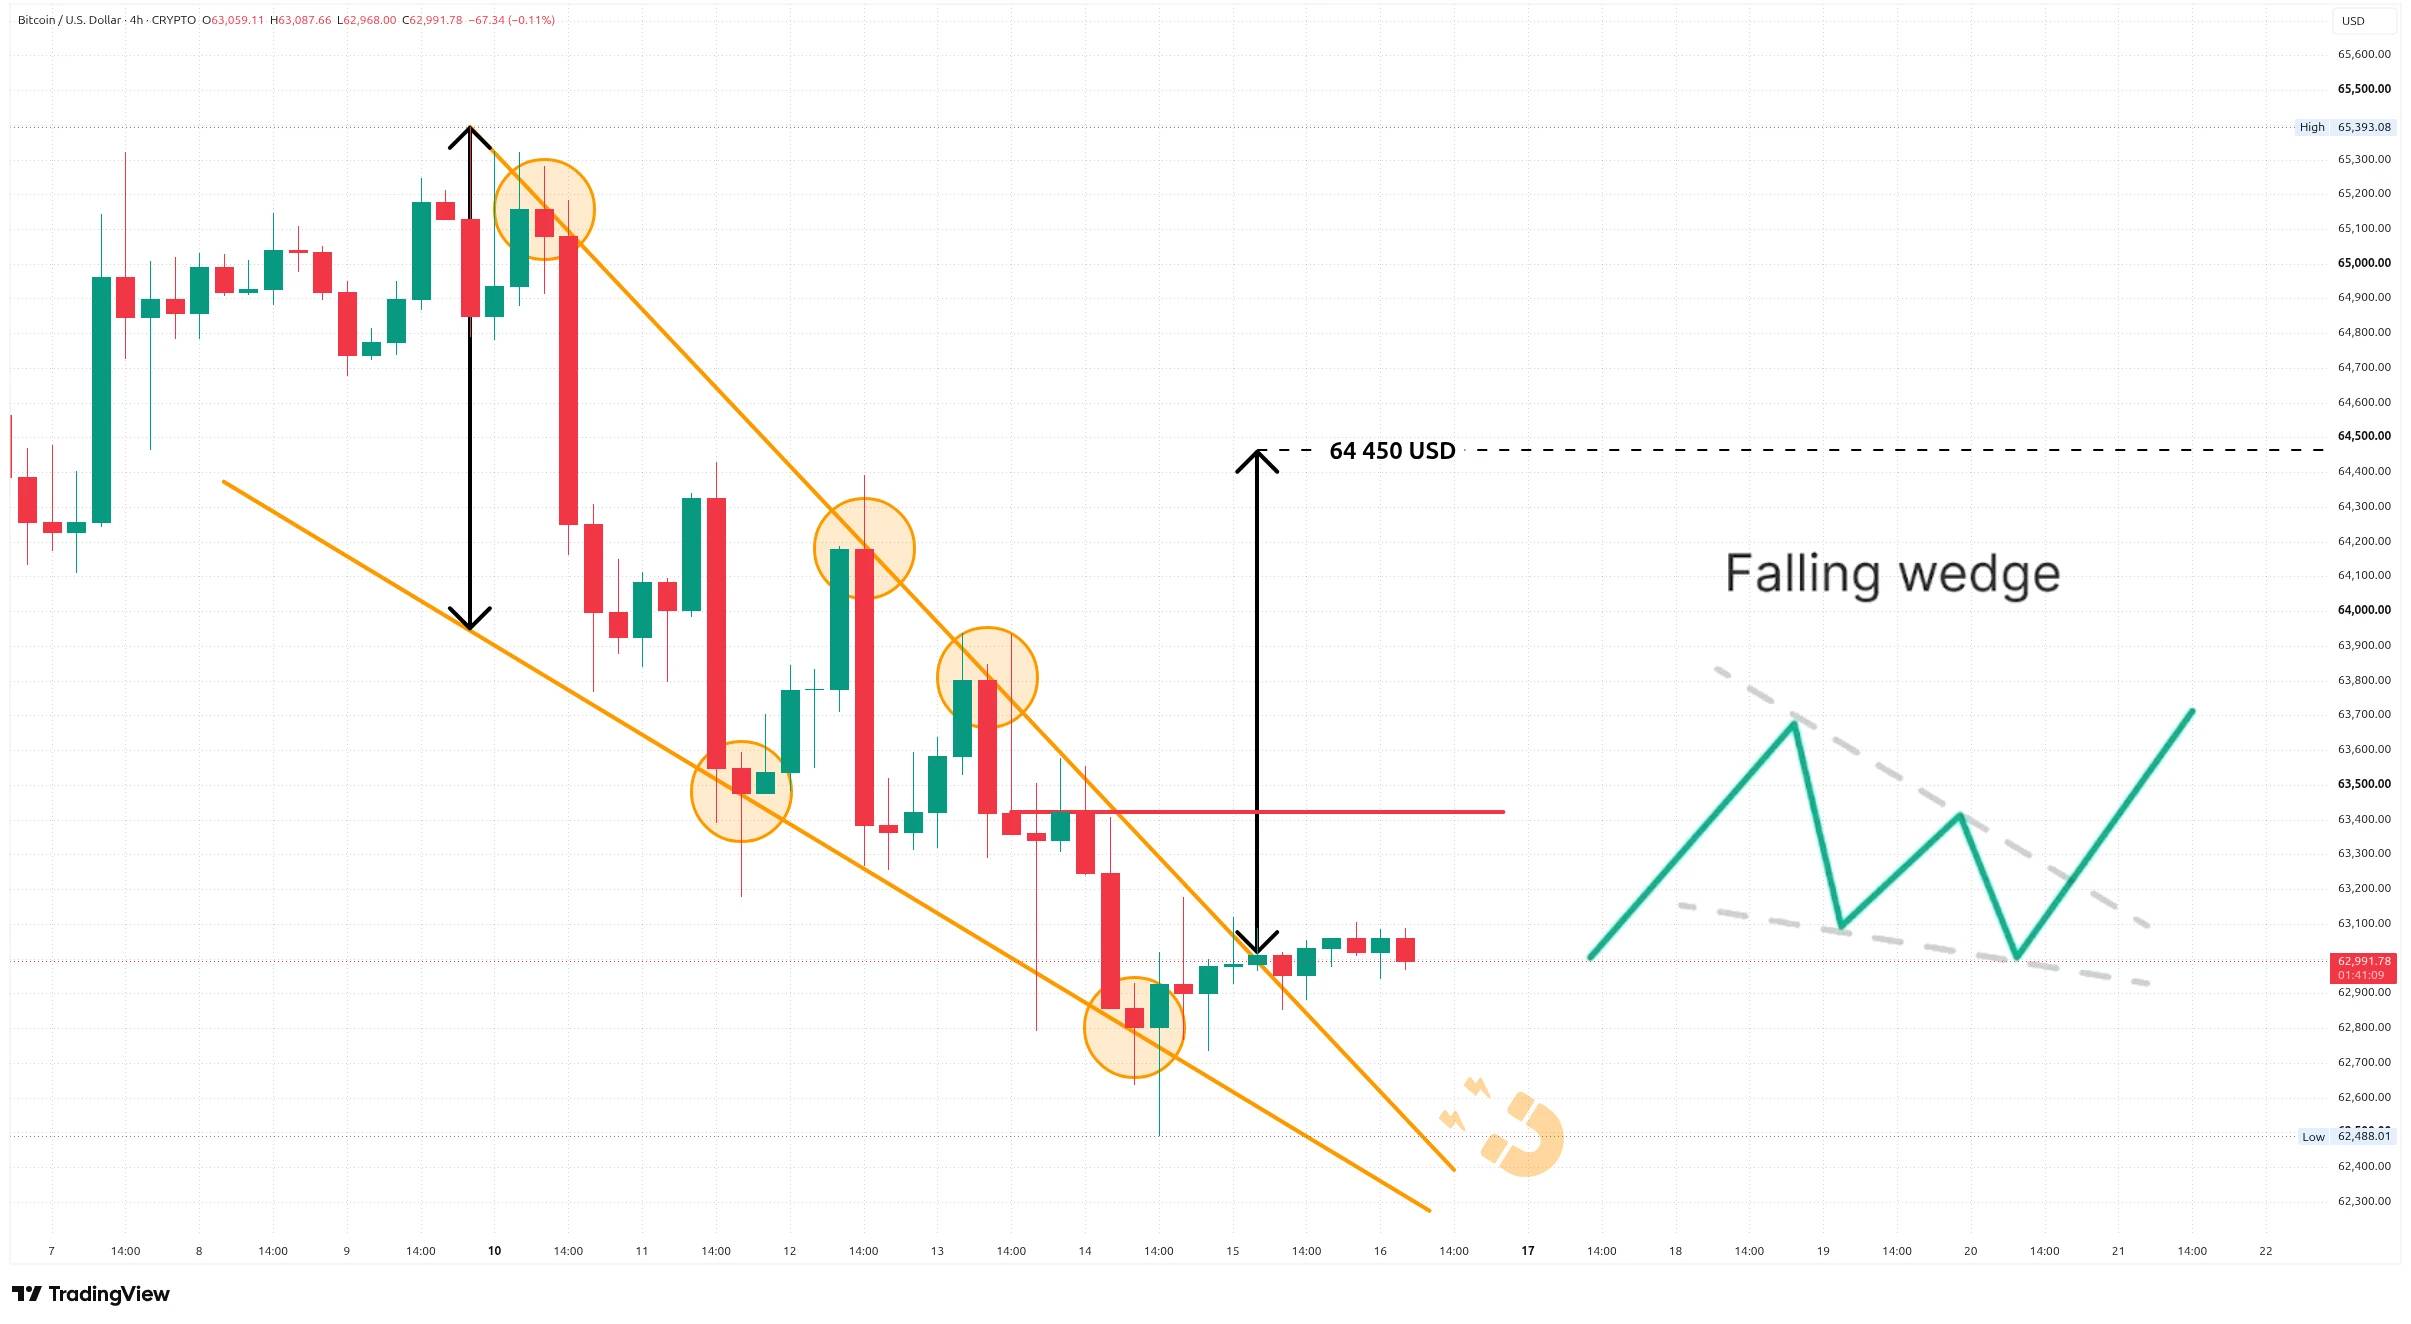
Looking at the four-hour chart, I see two clear descending trend lines converging. This is the basis for a bullish falling wedge formation. It looks like there was a breakout of the upper trend line yesterday morning, but given the weak weekend volumes, I wouldn't give it much weight yet.
I can easily imagine that we will return to the level of the trend line and test whether it has already become support. I would consider such verification satisfactory and could watch the target level of the formation, which comes out to roughly $64,450. As confirmation of this direction, I would like to see a higher high (above $63,400).
The daily chart also promises some growth
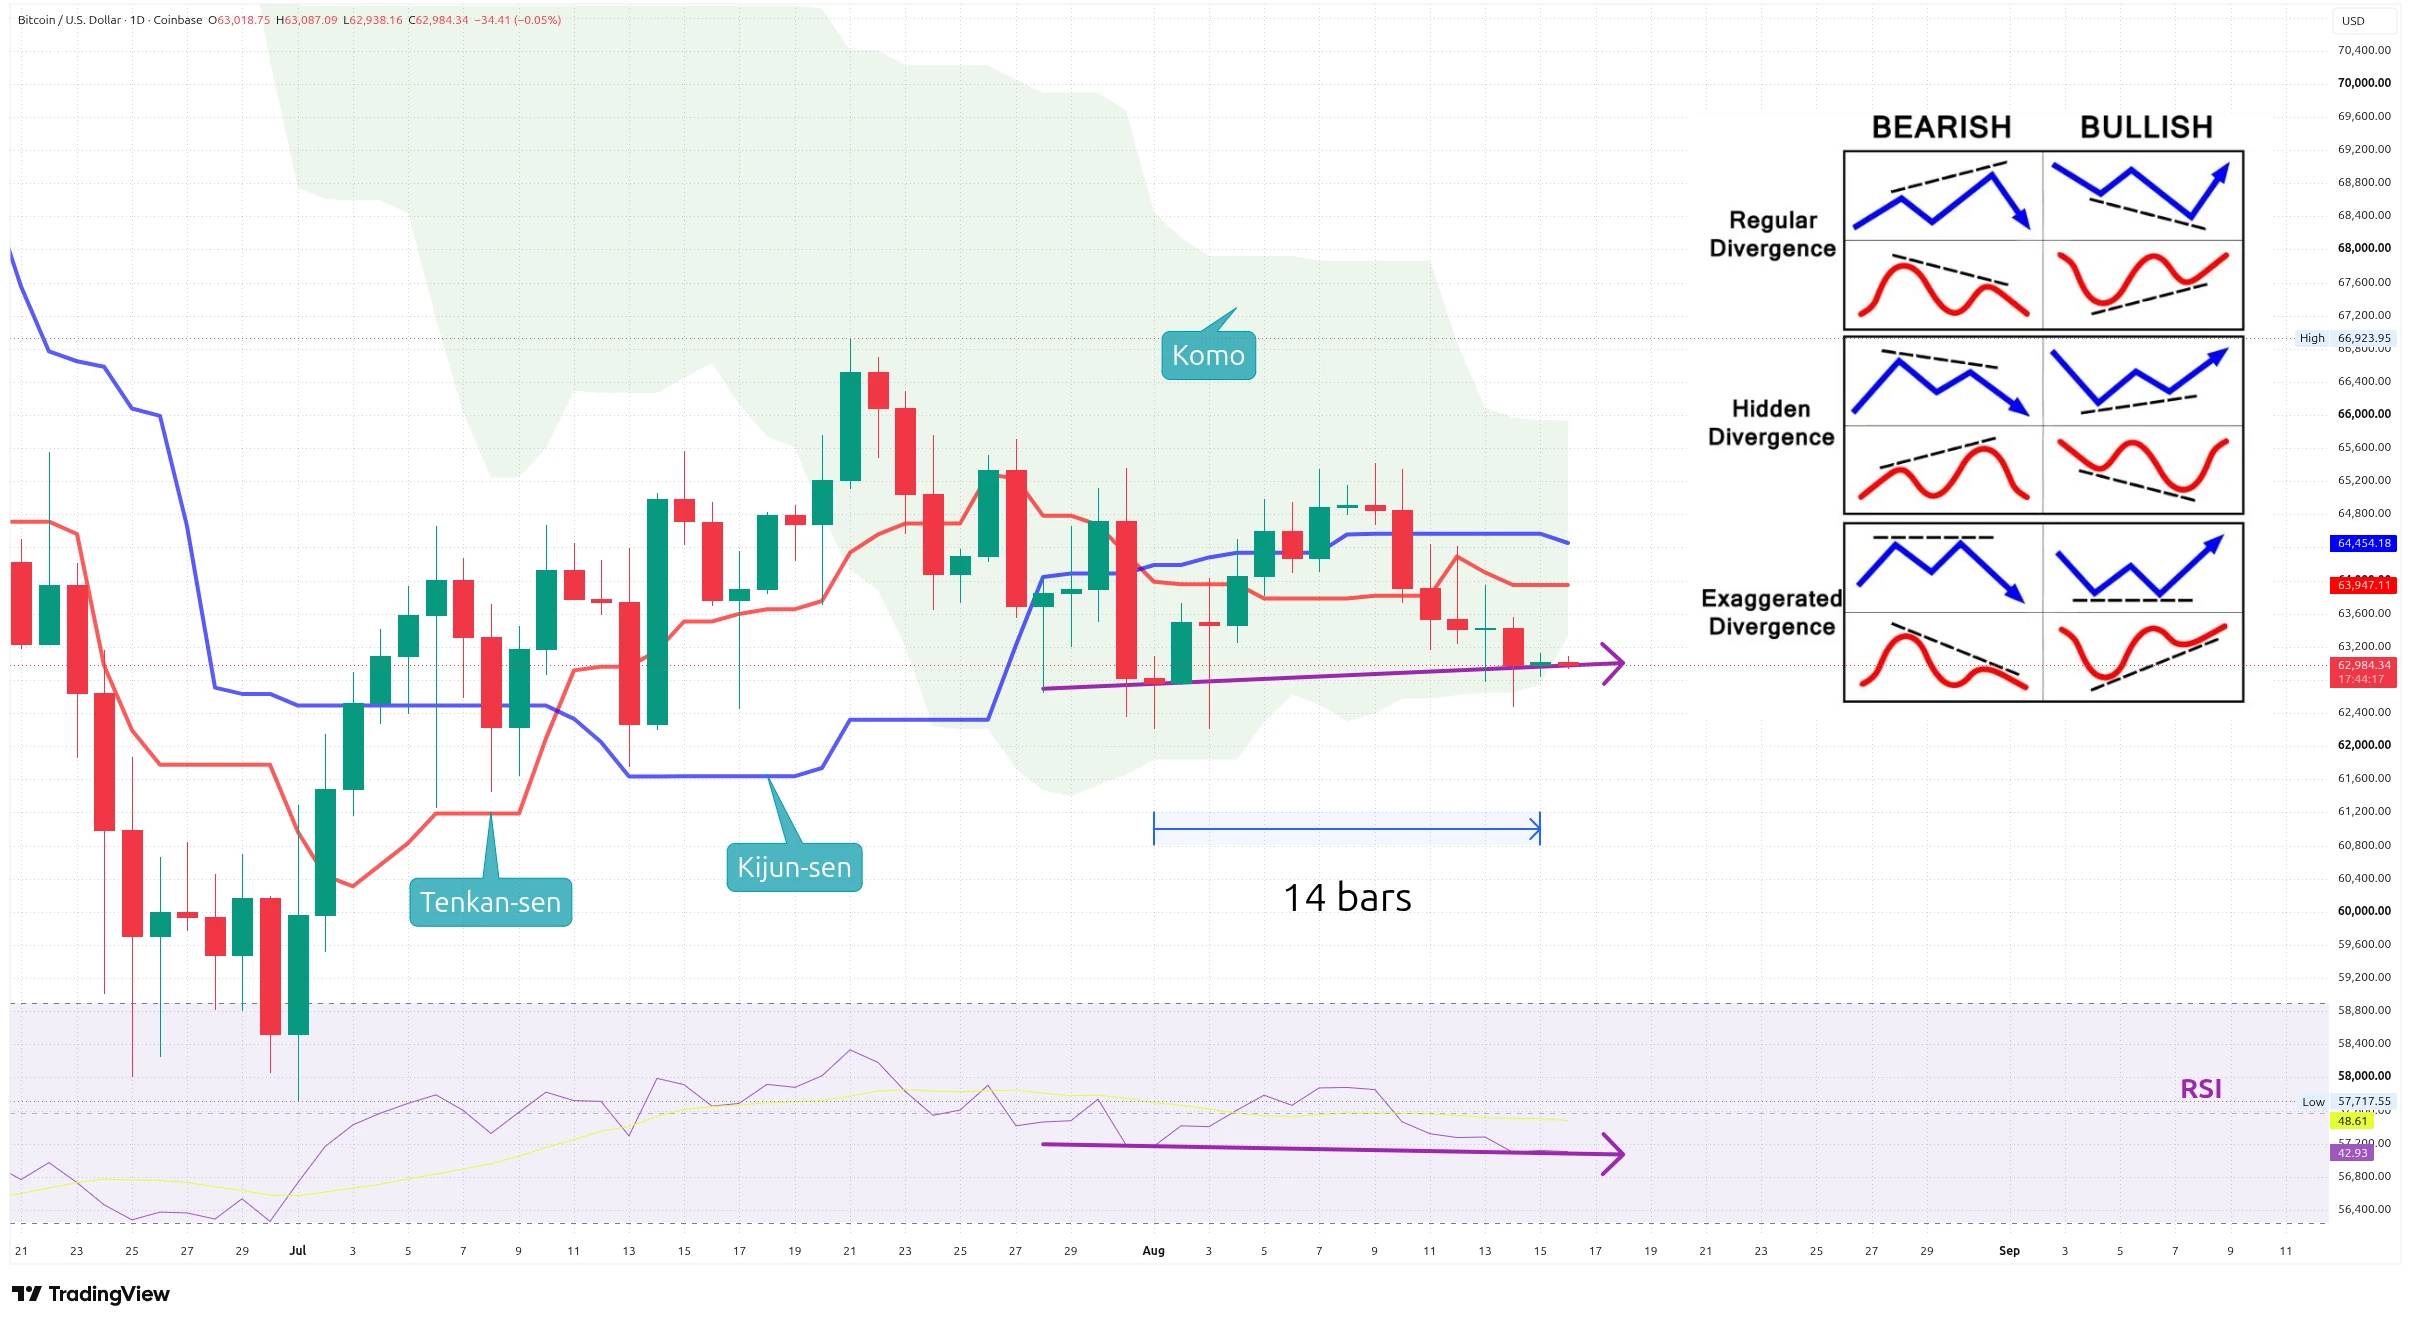
On the daily chart, I have marked my favorite indicator, Ichimoku Kinko Hyo. The short-term price trend (red, Tenkan-sen) is at the $63,950 level, where we have the first stronger resistance. Another resistance is at the $64,450 level, where the medium-term price trend (blue, Kijun-sen) is located. At the same time, I see that we are moving near the bottom of the Kumo cloud support zone. The $63,300 level thus forms another important point.
Looking at the last bottom, it is currently 14 candles behind us. This plays directly into the hands of monitoring the standard RSI indicator, which is usually calculated from 14 periods. Here I see a clear hidden bullish divergence. The price chart forms a higher bottom, while the RSI forms a lower bottom.
To confirm this divergence, of course, we need to see an actual bounce upwards. If it comes, we can expect further growth with a possible test of the aforementioned resistances. The upper part of the Kumo cloud is at the $65,950 level.
The weekly chart shows important supports and resistances
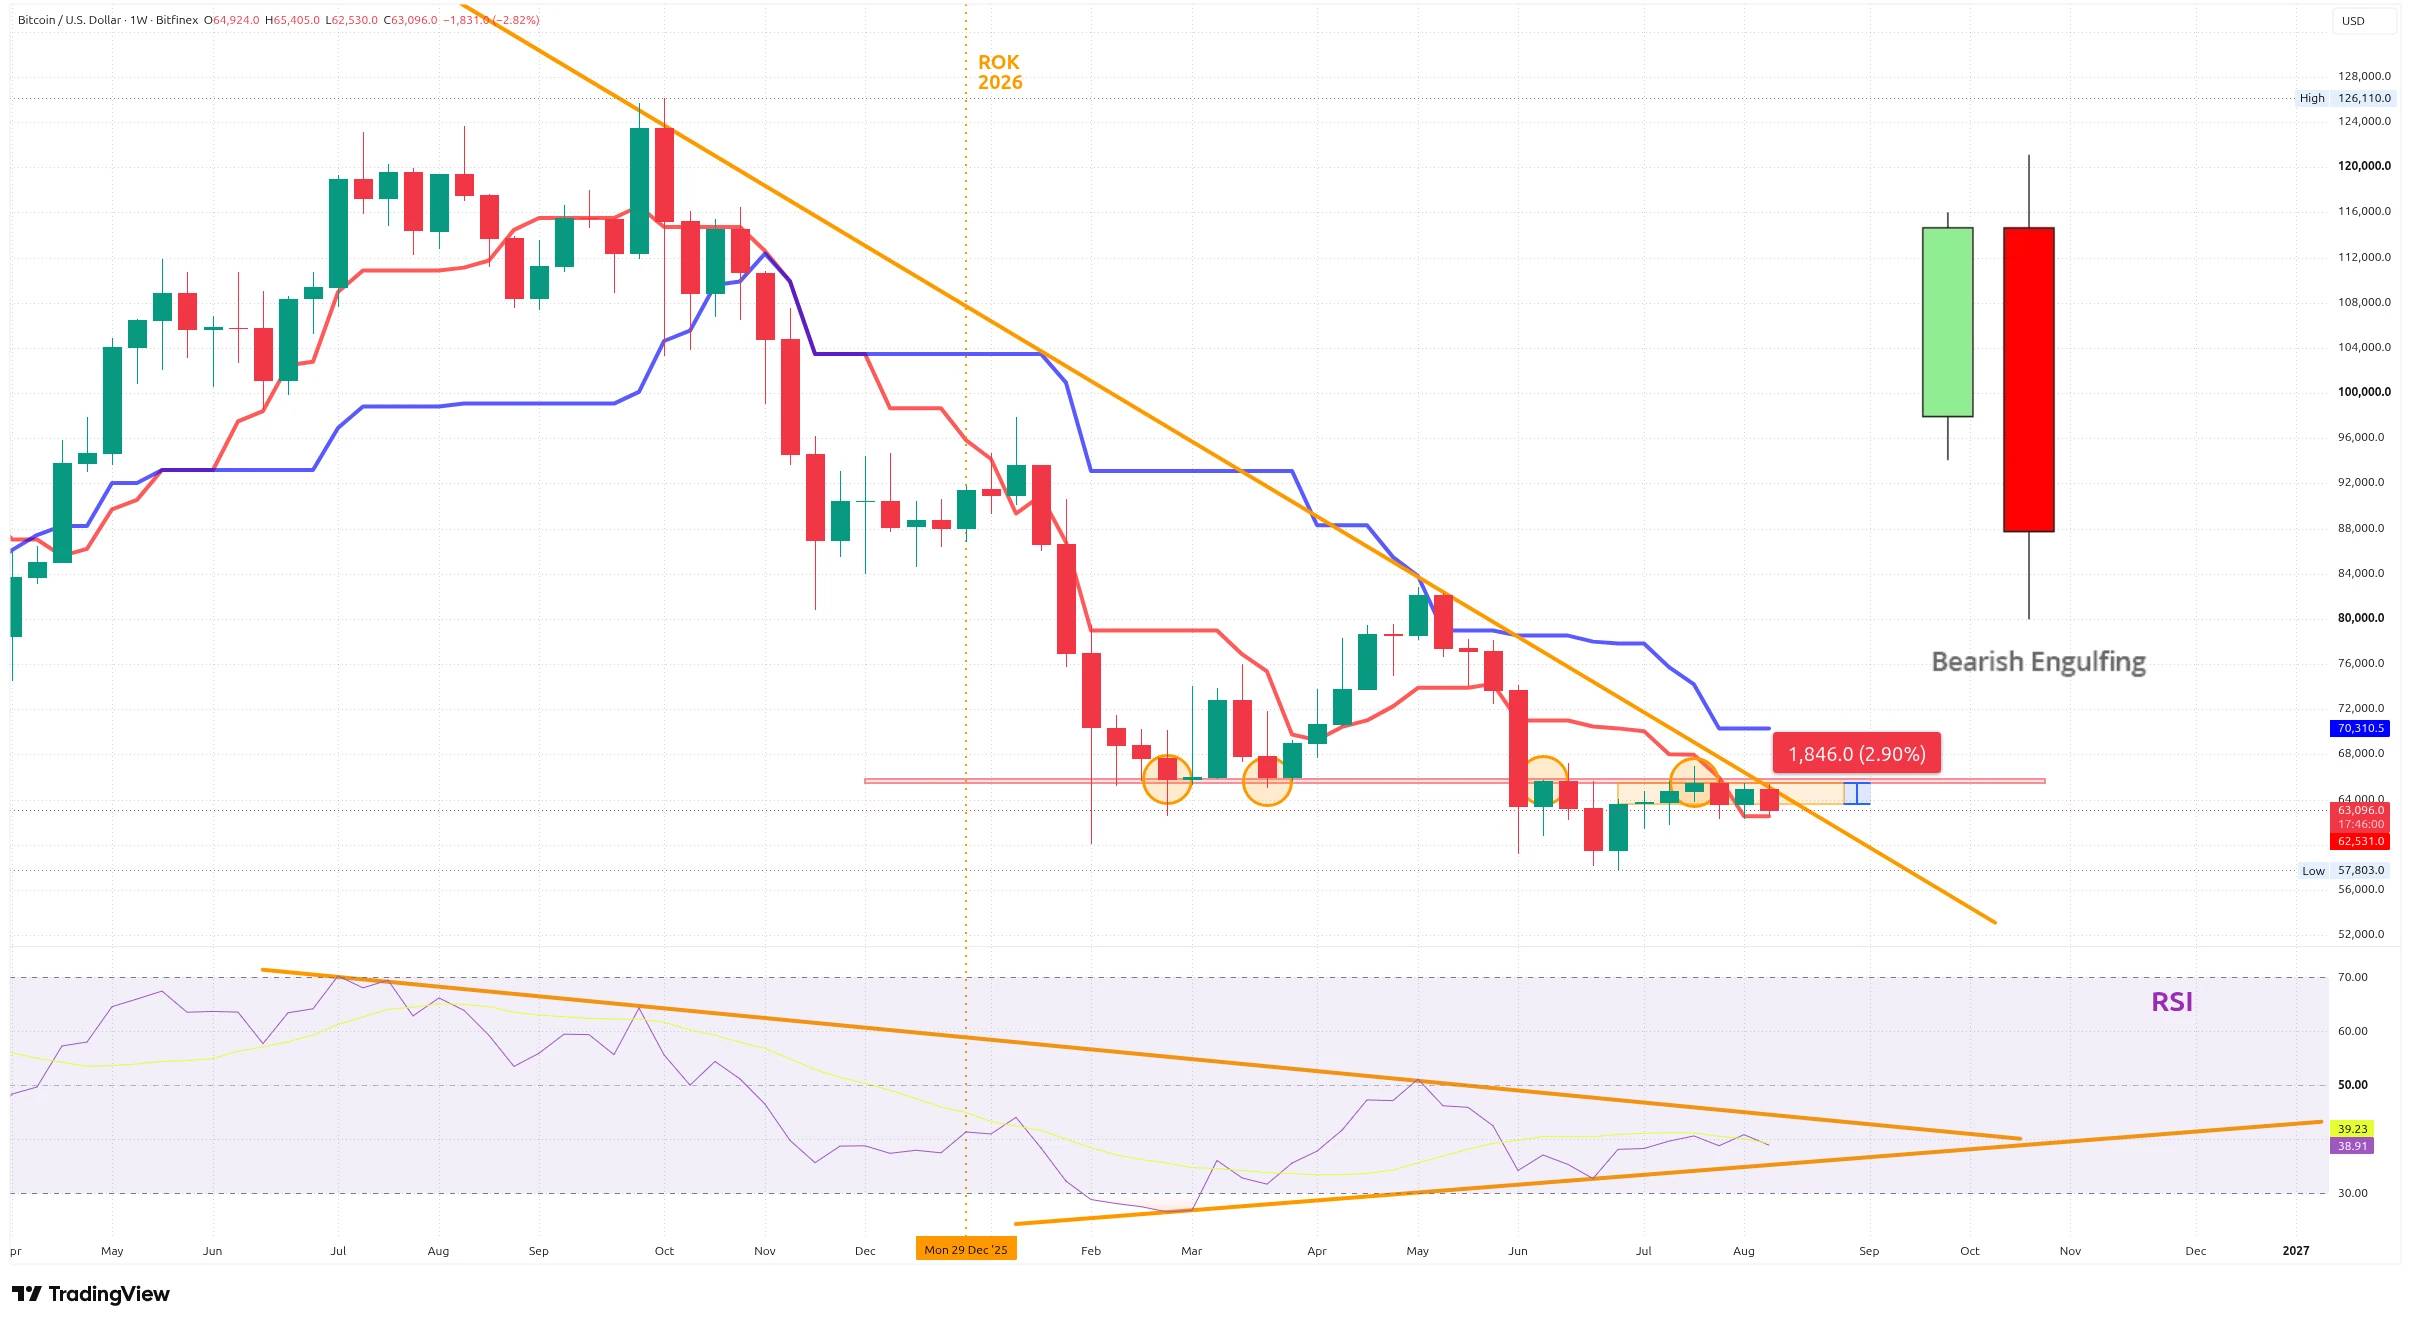
A descending trend line has been passing through the weekly chart for some time. It starts at the last all-time high and passes through this May's peak exactly through the high of the current red weekly candle. So we have already had the third test of this strong resistance.
At the same time, there was no breakout of the zone that created a double bottom for us in the spring and flipped into resistance in June. This zone currently forms the top of the area in which we have been moving for six weeks in a row. A range of 2.90% width is truly exceptionally small. When I looked for a similarly long and narrow consolidation band, I had to go back to August 2023.
However, it's not just about resistances. If I borrow the short-term price trend from the Ichimoku indicator, it is currently at the $62,530 level. Here lies a potential support that could hold us. However, we still lack volumes. But it can be expected that with the end of August and the beginning of September, activity could increase again.
I will watch today's weekly candle with expectation. If it closes below $63,600, it could be perceived as a bearish engulfing formation. This could negatively affect us until the end of August. In addition, two trend lines are added to the RSI, between which we are currently located. I assume that they could function as future support or resistance.
Other signals of an approaching bear market bottom
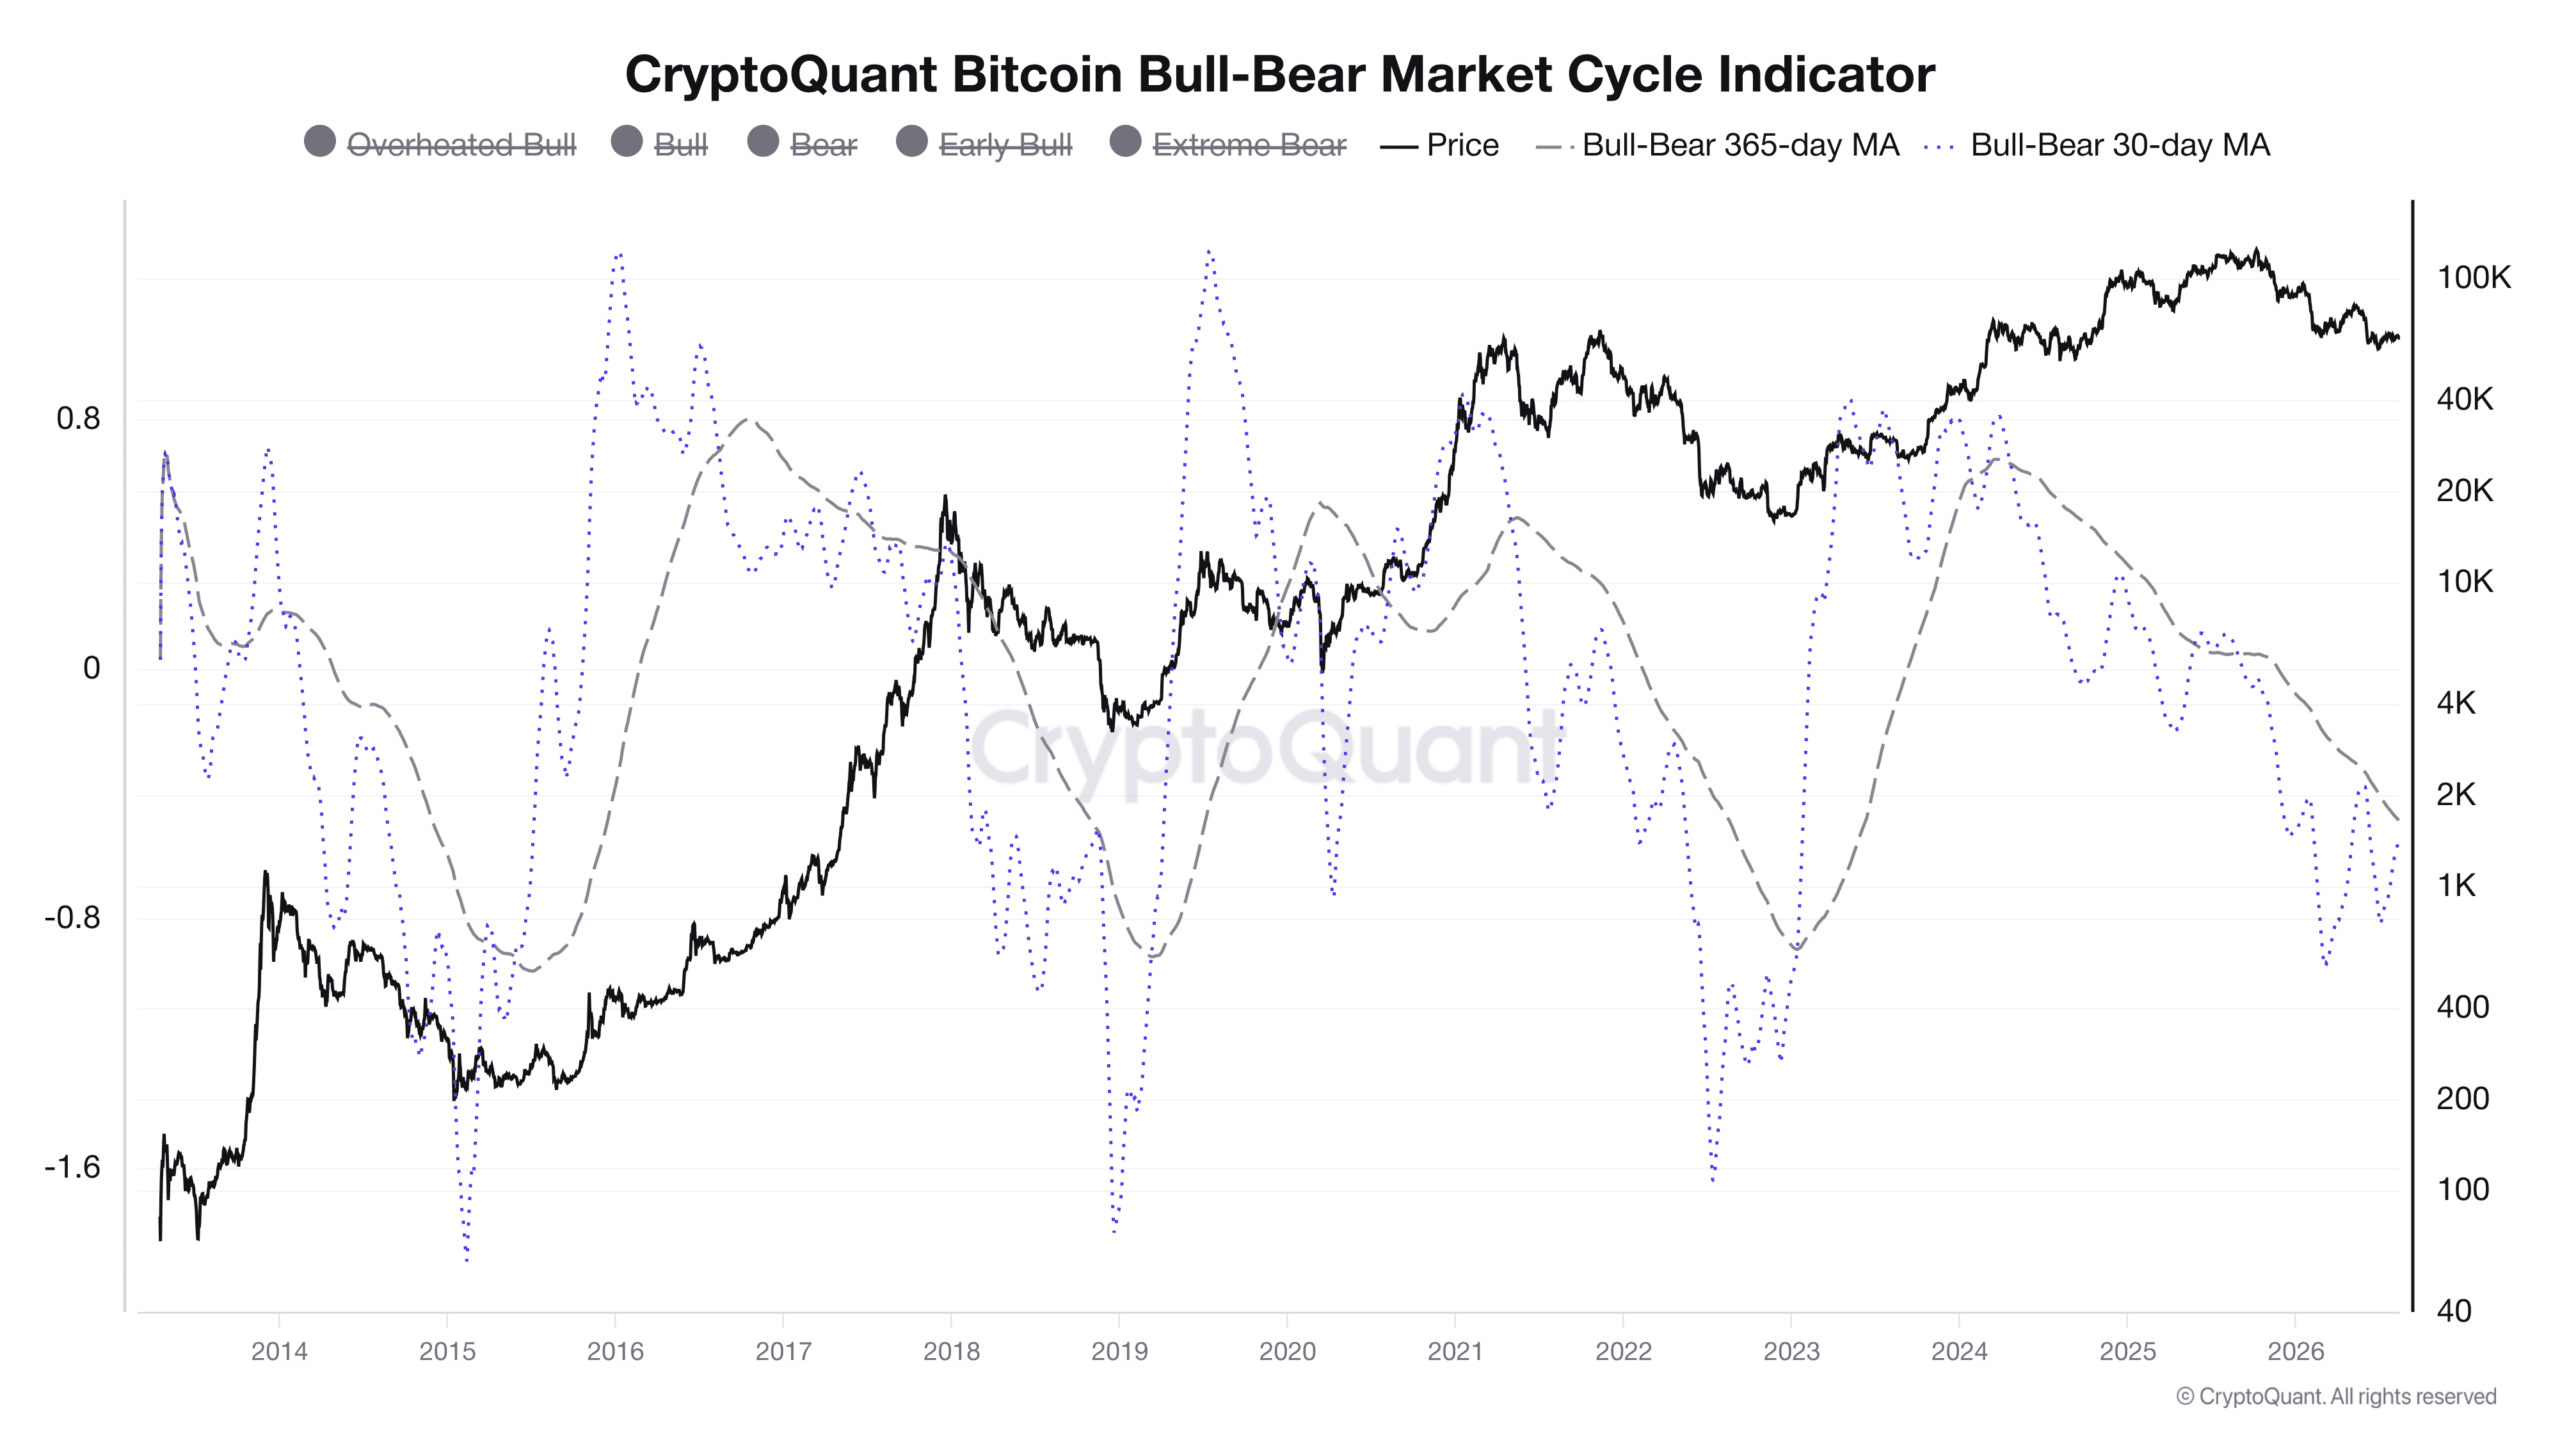
Of course, I also follow other tools to better understand the current market sentiment. For example, CryptoQuant has an interesting Bull-Bear Market indicator. Looking at its 30-day and annual moving average, I see that they are very close. Historically, the crossover of these two averages has often been a signal to end the bear market. It's not a 100% guarantee, but it's a strong additional signal.
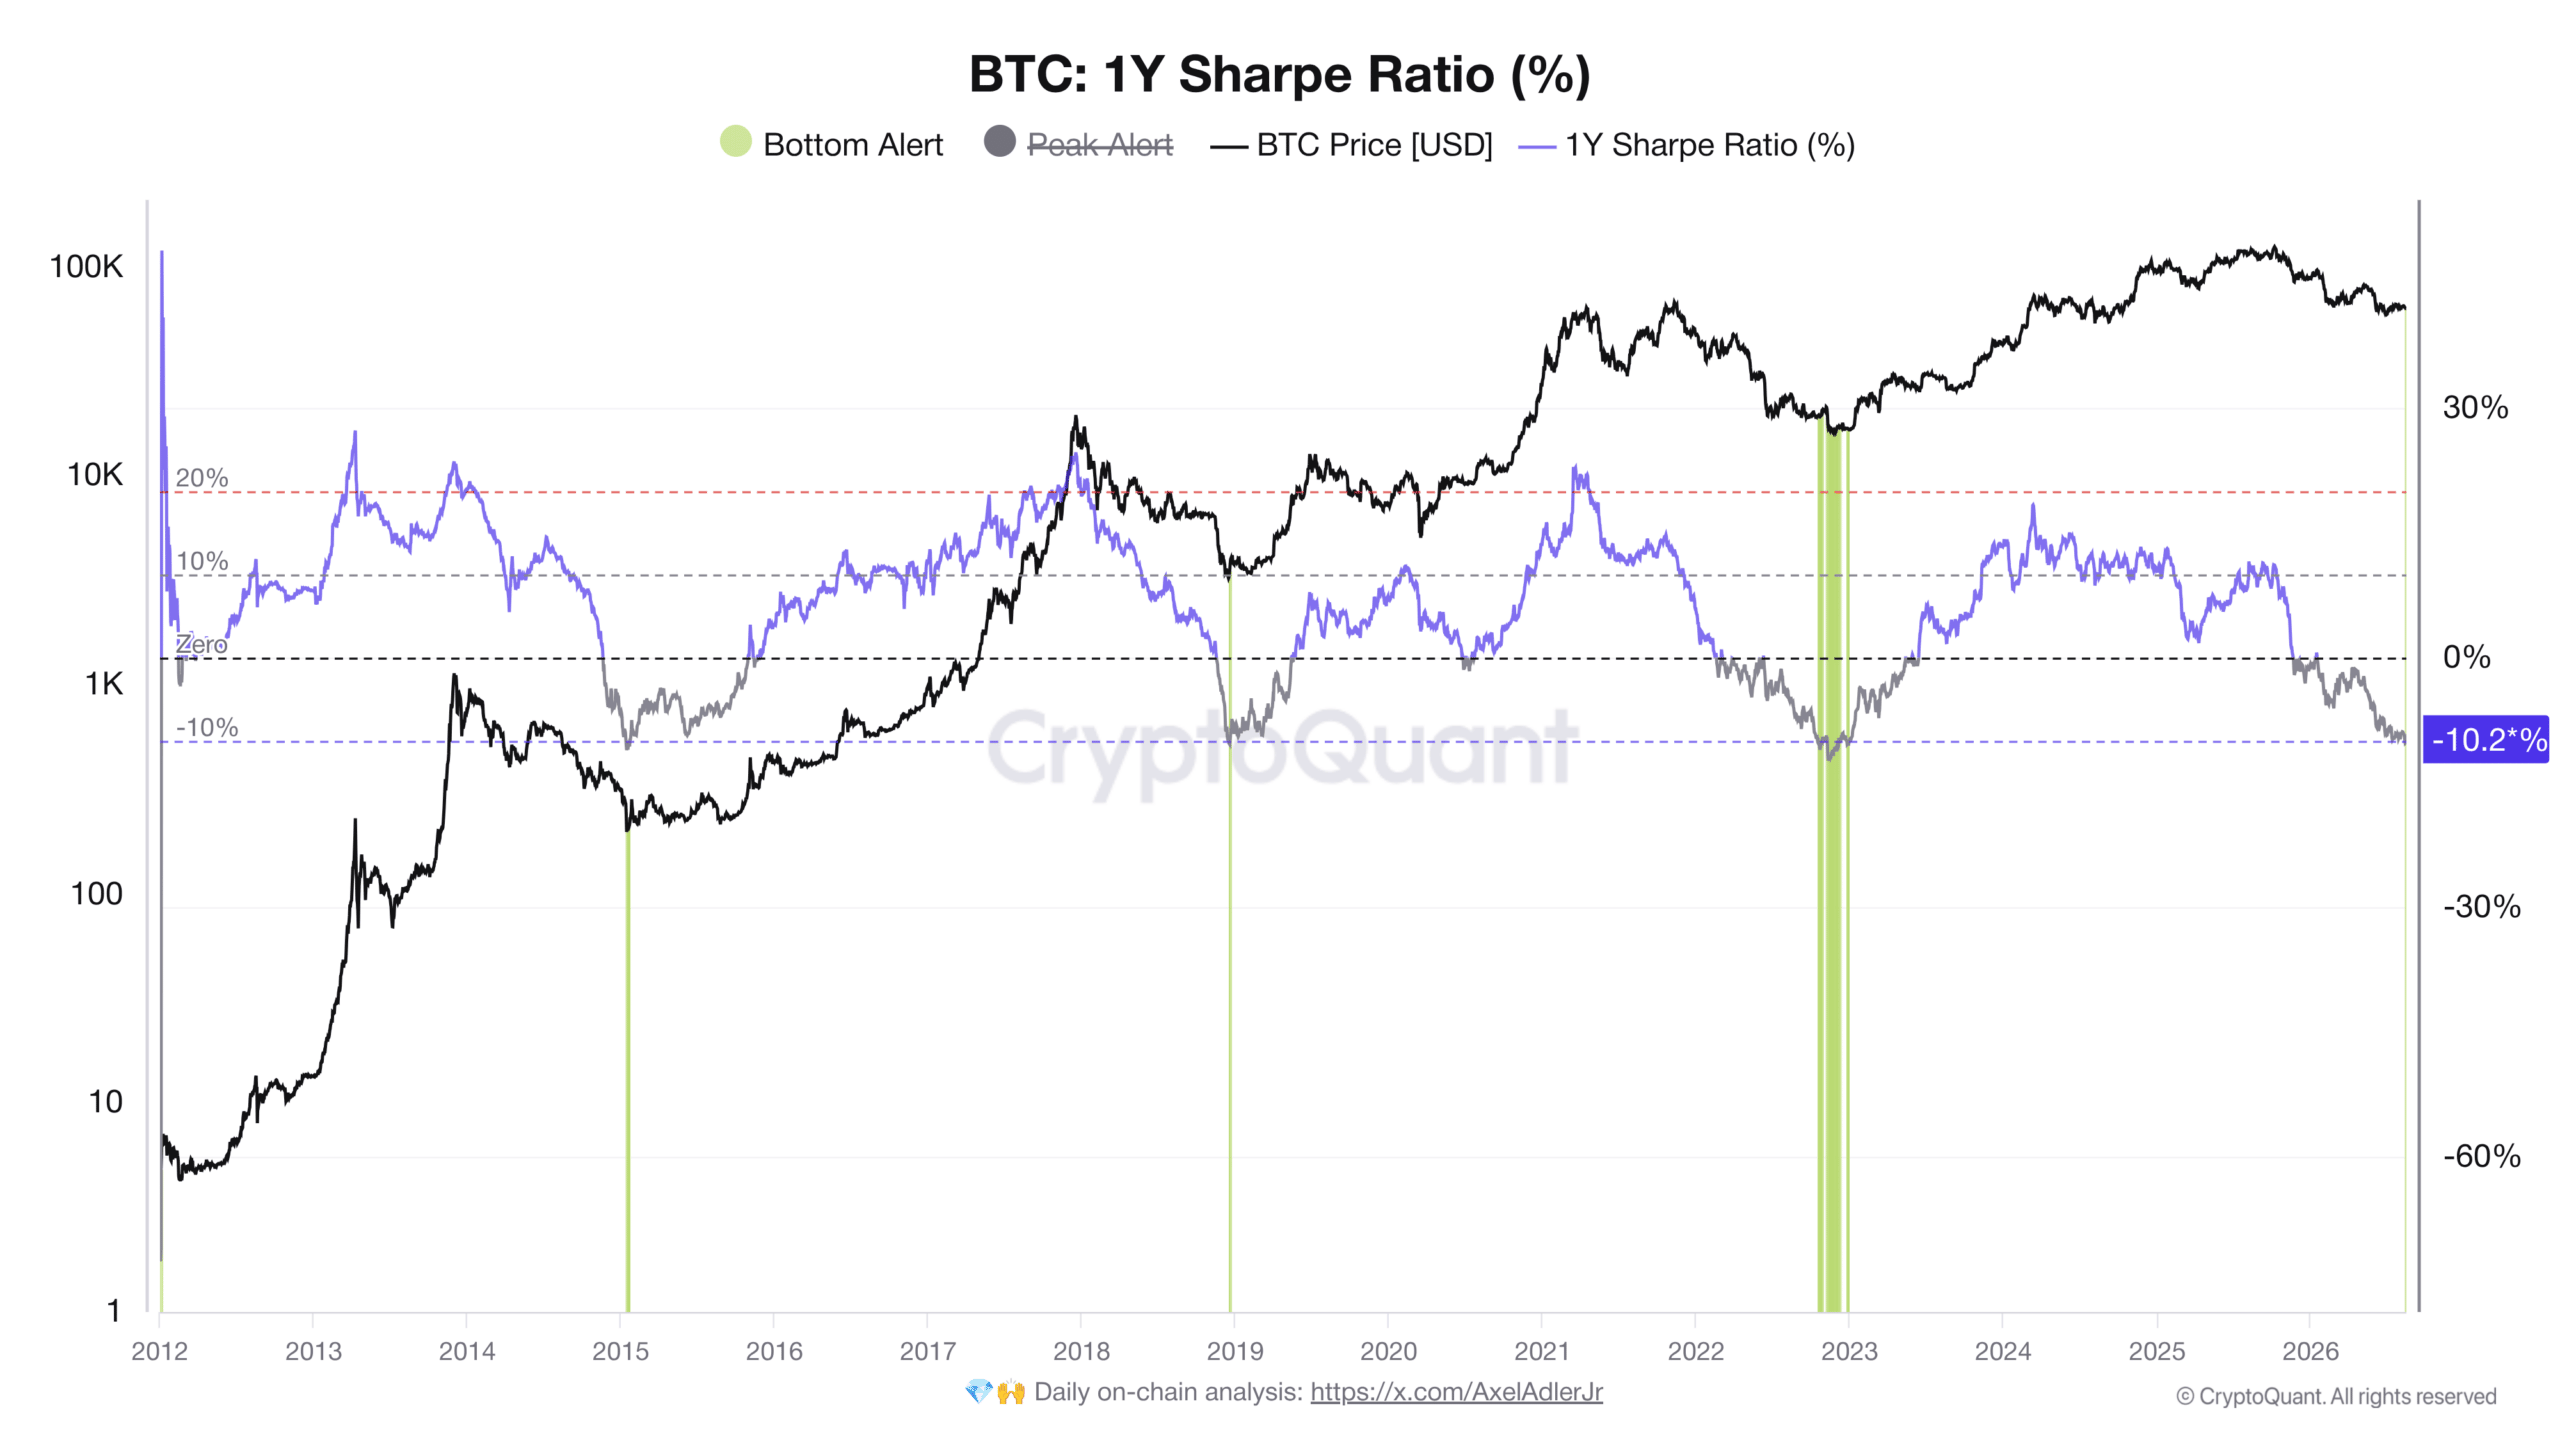
The Sharpe ratio offers another clue for an approaching bottom. This is a recognized indicator for evaluating investment quality because it expresses the additional return of an investment relative to the risk taken. On the analyzed chart, the percentage change over one year is measured. When falling below -10%, the situation is usually evaluated as a bottom. Historically, this has worked great, however, even here it may not guarantee identical development for the present.
How do professional traders trade?
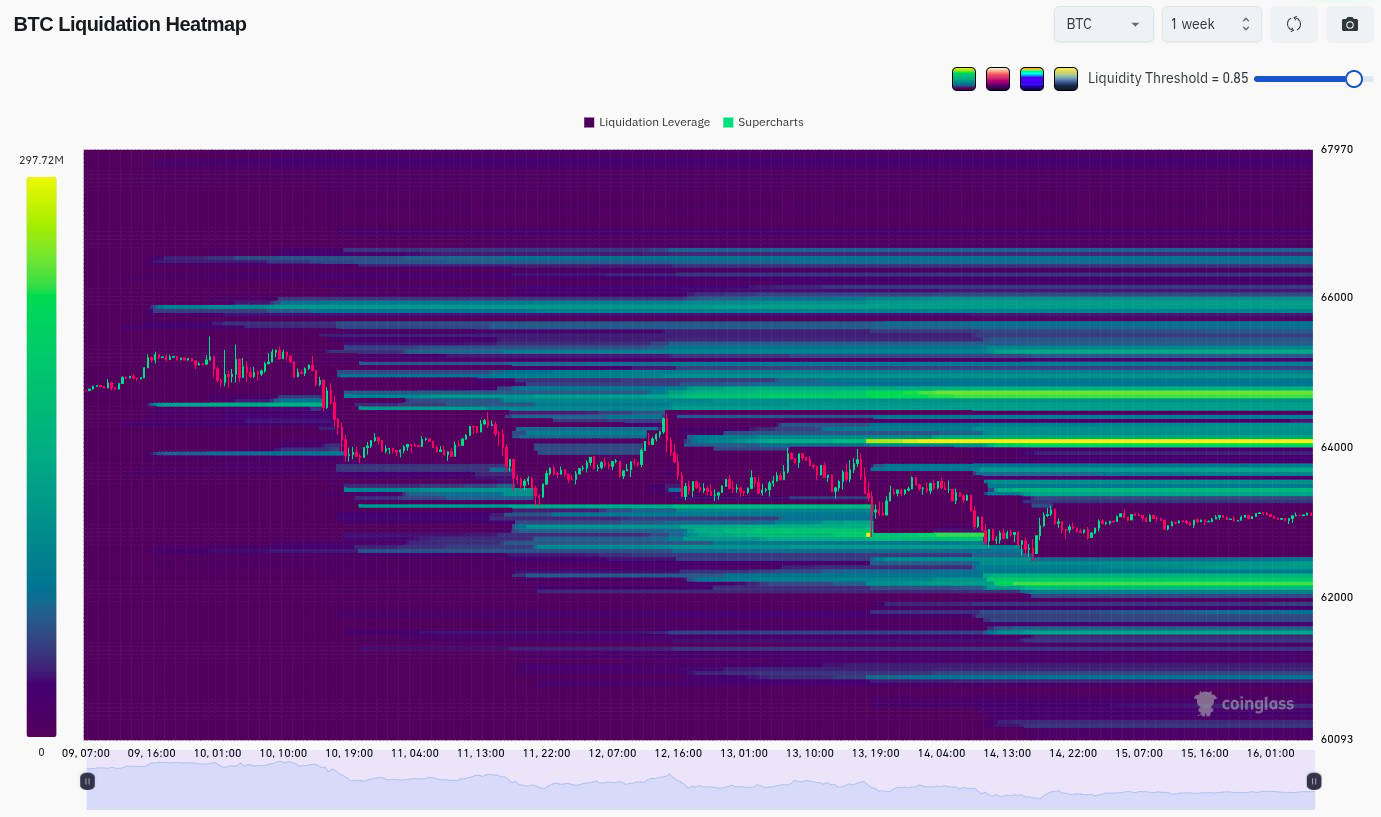
Of course, I don't forget to watch how large and professional investors behave. Given that we are moving in a relatively narrow range, it is logical that liquidity from leveraged positions is strongly accumulating both below and above us. Analyzing the past week, I see one significant accumulation coming from Thursday. At the $64,086 level, liquidity worth nearly $298 million is waiting. It is no secret that derivatives significantly influence and direct the market today.
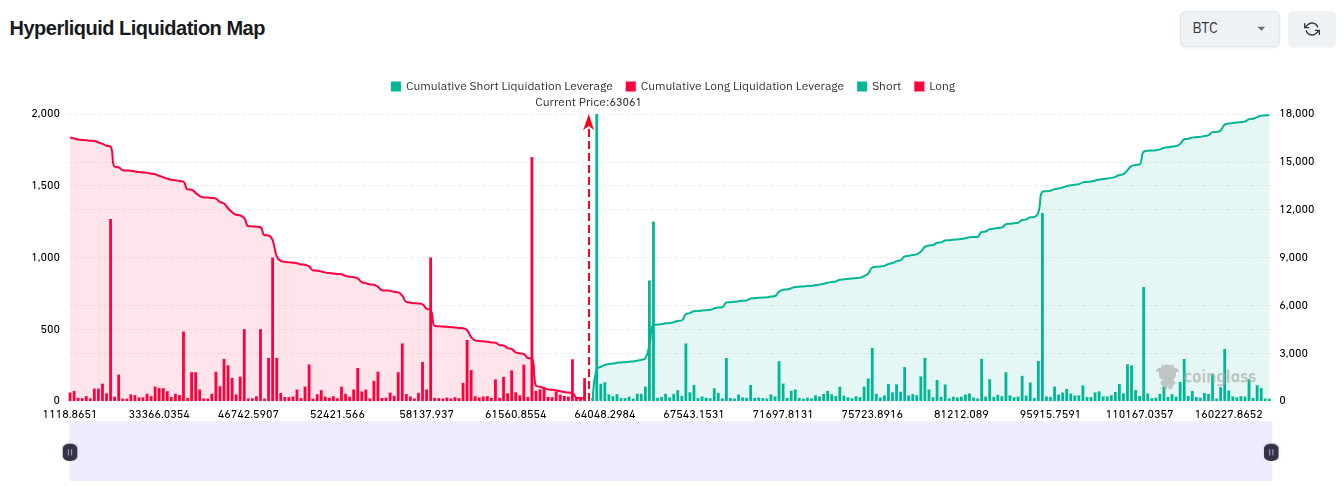
Looking at the Hyperliquid exchange, I see two whales right at the current price level. The first of them holds a large long position with a liquidation price at $61,850 (volume $3.37 million). The second, on the contrary, has a giant short position and a liquidation price set at $63,562 (position size $3.15 million).
Relatively bullish sentiment prevails on social networks
I also follow popular crypto analysts and influencers. Very often they come up with interesting insights and their thoughts spread through the community at lightning speed. For example, Benjamin Cowen, founder of the Into the Cryptoverse platform, points to the inexorable math of time windows. He points out that we are on day 1,363 of the cycle. Both previous cycles found their definitive bottom after 1,432 and 1,436 days from their start.
#BTC is now on day 1363 of the cycle (note the last 2 cycles bottomed on days 1432 and 1436) — Benjamin Cowen (@benjamincowen) August 15, 2026
Well-known trader Michaël van de Poppe closely watches the four-hour chart and looks for opportunities to open long positions. He notices a fairly resilient resistance at the $63,400 level. However, if the price falls below $62,250, he would start seriously considering opening a long trade. And if the rate fell below $61,000, he would likely go "all in." His target level for taking profit would then be the area around $64,600.
The chart of $BTC looks quite clear.
⛔️ Resistance zone of $63,400 is pushing back a potential breakout upwards. If that breakout upwards happens, I'm seeing a strong move to $64,600+ and likely a breakout upwards.
✅ The first area, of personal interest, of looking for longs… — Michaël van de Poppe (@CryptoMichNL) August 15, 2026
Experienced trader Tracer, on the other hand, watches the long-term weekly chart. For him, a very simple but functional strategy applies: when the price falls below the 200-week moving average (200WMA), it's simply time to buy. And if the price has been above this average continuously for more than 1,000 days, it's time to start selling. According to him, there's no point in dealing with anything else; the rest of the market noise is negligible.
THIS IS THE ONLY $BTC CHART YOU NEED!!
No indicators and systems needed:
BTC below MA200 → buy
BTC above MA200 past day 1,000 → sell
Three cycles. Same signal. Same result every time.
Everything else is just a noise… — ᴛʀᴀᴄᴇʀ (@DeFiTracer) August 15, 2026
Analyst going by the nickname Ted Pillows focuses on leverage data. He points out that Open Interest on derivatives is currently reaching its highest levels in 3 years. Historically, such a high level of financial leverage in the system usually doesn't end well for many traders.
Bitcoin Open Interest is now at its highest level in 3 years.
Too much leverage is back, and this only ends with people getting rekt. — Ted (@TedPillows) August 15, 2026
What awaits us next week?
We have analyzed facts, indicators, potential formations, and market sentiment. Let's now look at the following week. Which events could bring the much-needed impulse and volatility? From the perspective of planned macroeconomic data releases, it doesn't look very hot. On Tuesday at 2:30 PM, the United States announces building permits and housing starts. I don't expect big moves here.
Wednesday could carry on in a very similar spirit. At 8:00 PM, the Federal Reserve (Fed) will release detailed minutes from its last meeting regarding interest rate settings (so-called FOMC Minutes). Historically, these documents have often led to some short-term volatility, but given the current communication style of central bank officials, it can be expected that these minutes will again be quite dry and uninteresting.
However, markets could be pulled out of lethargy by a wave of interest stemming from Wednesday's cryptocurrency summit at the White House. According to well-informed sources, the US President, the head of the CFTC, and the chairman of the SEC should attend in person. Key industry leaders such as representatives from Coinbase, Ripple, a16z, Chainlink, Paradigm, Kalshi, and lobbyists from the Digital Chamber are also expected.
🇺🇸UPDATE: Trump will personally attend Wednesday's crypto summit, joined by the heads of BOTH the SEC and CFTC.
Executives from Coinbase, Ripple, a16z, Chainlink, Paradigm and Kalshi are expected in the room, per Semafor.
The summit kicks off a two day stretch, with the CFTC… — Coin Bureau (@coinbureau) August 14, 2026
The entire block packed with meetings will continue on Thursday under the auspices of the CFTC's innovation advisory committee. The theme of both days will resonate with clearer regulation of cryptocurrencies, artificial intelligence, and oversight of innovation in financial markets. In this case, I would expect that more significant news and speeches could trigger more visible Bitcoin volatility.
What could be the next development of the Bitcoin price?
Let's summarize all findings comprehensively. On the hourly time frame, there is uninteresting boredom. Every night the price oscillates in a sideways band and the weekend was no different. It starts to look promising only on the four-hour chart. Here, the possibility of a formation breakout is offered, but this requires confirmation and a breakout of the upper trend line followed by the creation of a clear higher high (ideally above the $63,400 mark).
Realization of this scenario could lead directly to testing the Tenkan-sen ($63,950) and subsequently Kijun-sen ($64,450) levels. However, if the weekly candle closes again somewhere above $63,600, we continue in the lethargic zone of indecision. This can be partly explained by traditionally weaker activity due to holidays and summer, and partly by the euphoria of investors who, instead of cryptocurrencies, are now rather moving capital into the all-time highs of the S&P 500 stock index.
From the perspective of so-called non-price indicators, however, I perceive a promising dose of signals announcing the proximity of the bear trend bottom. It sounds great and adds optimism, but it never guarantees that we cannot test even lower levels. Just remember the development in 2022, when it also looked like we had the worst behind us, and then the FTX exchange unexpectedly collapsed.
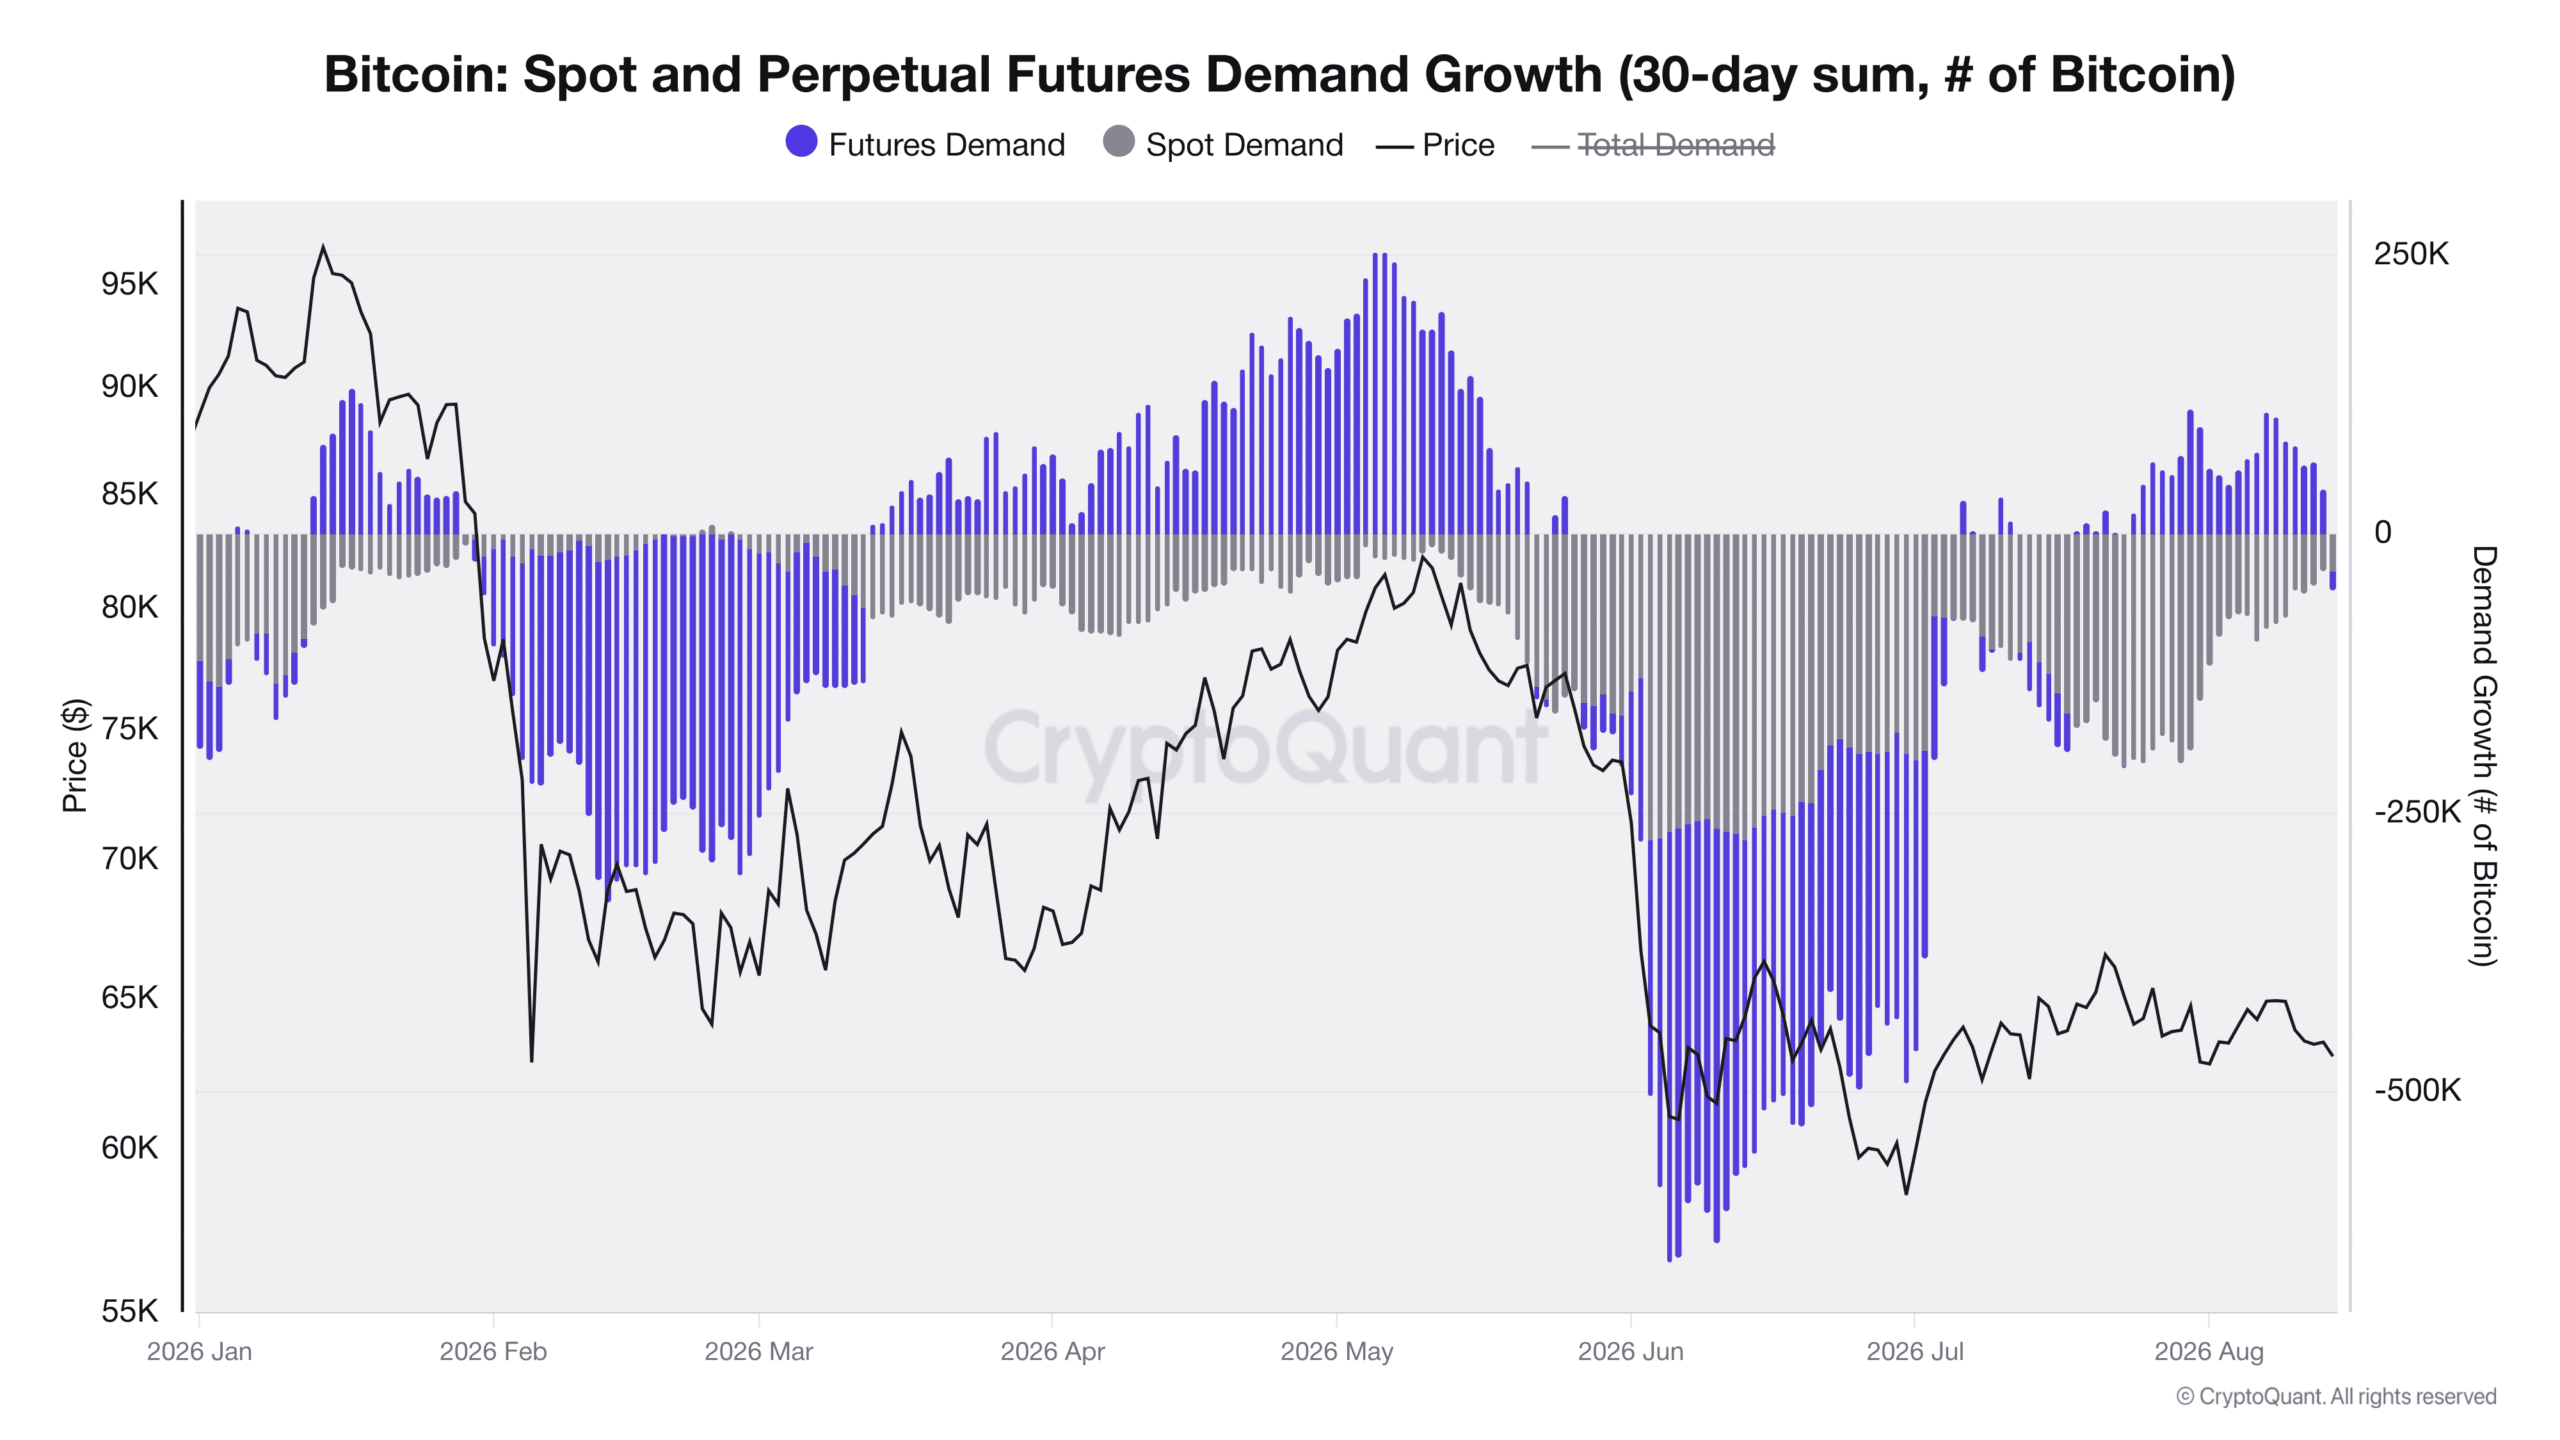
On the other hand, one cannot overlook the significantly growing appetite for cryptocurrency derivatives. If similar interest were to move and reflect in spot purchases, a potential market reversal could be much healthier and more permanent. In the opposite scenario, without the support of real purchases, there is a risk sooner or later of a wild liquidation of overbought positions. And frankly, spot demand since the beginning of the year is still rather stagnating in slightly negative values.
How will I trade?
Strong liquidity is now accumulating above the current market price. I can very realistically imagine a scenario where the market simply goes for it. I have already closed my own short positions for preventive reasons and now intend to slowly focus on opening long positions. I am spreading my buying strategy in gradual steps down to the price area around $60,000, where the market could hypothetically go once more for missing liquidity before a potential larger bounce.
If the trade works out, I would like to start gradually closing long positions somewhere around $64,000. The strong accumulation of leveraged liquidity gathered over the past week should, in my estimation, function as a magnet. However, I point out that this is the current state in the order book and in such a fast market environment, the liquidity listed today may not be there at all tomorrow.
In conclusion, I traditionally appeal to the fact that my mentioned trading plans are not investment advice or a guaranteed recommendation. The article represents exclusively my personal analysis and opinion on the events around the Bitcoin market. Before you put your money into the market, carefully conduct your own research of the situation, define a clear risk management with a cool head, and strictly follow it. Do your own research (DYOR).
Crypto, Web3, and technology enthusiast. My portfolio includes cryptocurrencies, stocks, precious metals, crypto derivatives, and NFTs. I primarily make decisions based on technical analysis while considering macroeconomic indicators.