
Bitcoin Jumps Depending on How the United States Wakes Up
Bitcoin is experiencing a wild week influenced by events in the US and speculation about Fed actions. While attacks in the Strait of Hormuz pushed the price down, statements from Christopher Waller and moves by MicroStrategy shot the exchange rate to new highs. Read the analysis of current scenarios.
This week has been an emotional roller coaster for Bitcoin. And those emotions primarily came from the United States, where there is constant speculation over a possible change in the benchmark interest rate. The Fed meeting is just 9 days away, and the market still hasn't clearly decided what the outcome might be. Today, we will try to assess the situation again and find potential future scenarios.
First, let's look at the details of this week. It is always useful to realize which events influence cryptocurrencies and in which direction the Bitcoin price reacts to them. As mentioned, this week was mainly about events associated with the world's largest economy – the USA.
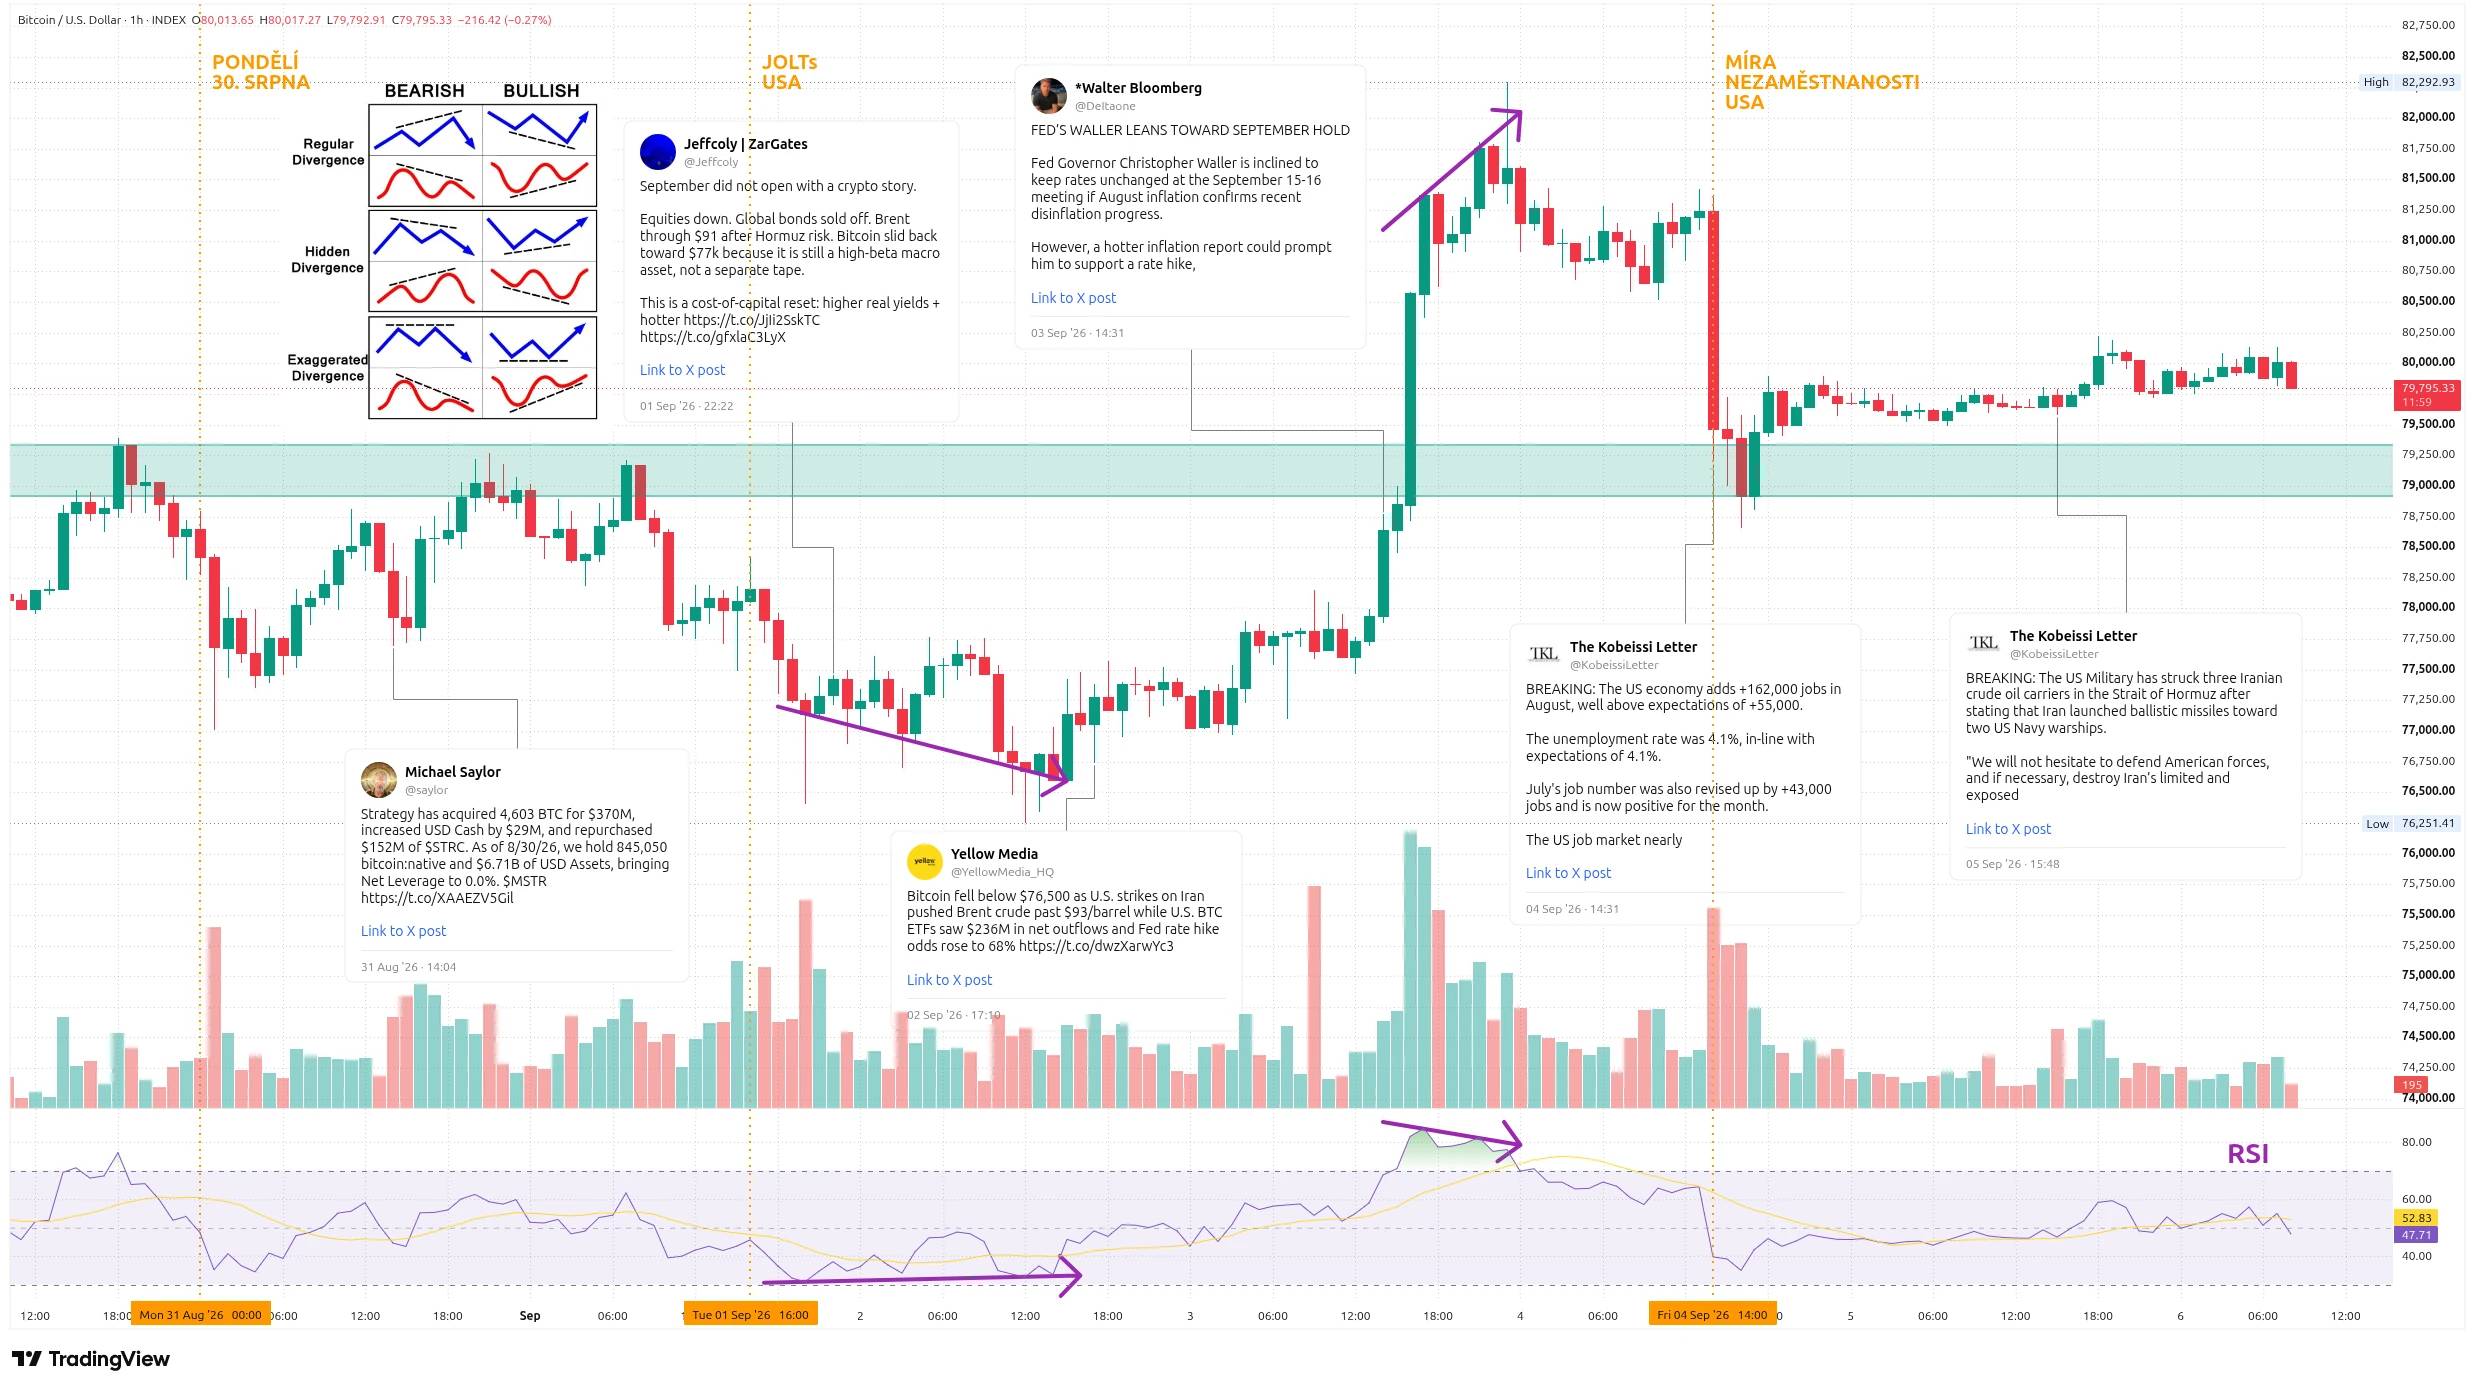
At the time the last analysis was published, the Bitcoin price was hovering just above $78,000. However, growth came in the afternoon, and around 6 PM, the price attempted to break through the $79,500 level. There seems to be an interesting level there that acted as resistance on Sunday evening.
A rejection followed, and we entered the new week again around $78,000. We fairly quickly picked up liquidity down to the $77,000 level, and then growth came, supported by speculation around MicroStrategy. Michael Saylor posted his tracker on Sunday evening with the note "We’re ₿ack".
There was speculation about how many bitcoins they bought in total and what the reaction would be. In the end, it was 4,603 coins, and they even managed to retroactively buy STRC for $152 million. Positive news, and after the opening of the US stock exchanges, further growth followed with an attempt to break $79,500. Again, unsuccessfully. However, the rejection didn't knock us down much, and during the night after the Asian markets opened, another attempt to break the zone occurred. Again, it failed, and a more decisive rejection followed – by 10 AM, the price was already moving around $77,800.
Situation in the Strait of Hormuz Continues to Impact Markets
The decline continued as attacks began again in the Strait of Hormuz. As a result, the price of oil jumped up, and the Bitcoin exchange rate, for a change, continued to decline. Furthermore, markets were increasingly pricing in Kevin Warsh's Friday speech. According to Wednesday's figures, the market expected a rate hike at the September meeting with a 68% probability.
At that time, however, we can see that while the price chart was looking for a lower bottom, the situation on the Relative Strength Index (RSI) was already starting to change. Generally, the chart was already moving around the oversold zone, and a bullish divergence began to form. This started to play out, and the Bitcoin price began to rise after defining the weekly low ($76,251). However, it was a very slight increase associated with a gradual return of the RSI to the center.
The market was waiting for the afternoon speech of Fed member Christopher Waller. His views are often perceived by markets as rather dovish, so traders were trying to evaluate whether he would confirm the chairman's strict stance.
In an interview, Waller stated that if the current state of inflation is maintained, he is prepared to leave the rate unchanged. Although the entire interview could not be evaluated as unequivocally optimistic, the markets saw it differently. The probability of a rate hike in September suddenly dropped significantly, and everything flew up. Including the Bitcoin exchange rate.
By Thursday midnight, the price reached $82,300. The RSI shot up to almost 85 points, indicating an unequivocally overbought market. At that time, emotion definitely ruled the market, and we flew straight through the resistance zone around $79,500.
Labor Market Gives Fed Room to Raise Interest Rates
The growth was also fueled by the liquidation of leveraged positions. That day, short positions wrote off more than $470 million. The price rose, but a bearish divergence began to form on the RSI, waiting for a signal to be filled.
That came on Friday afternoon when the United States released its unemployment rate. It met expectations (4.1%), but in detail, 162,000 new jobs were added compared to the expected 55,000. This means the labor market is strong, and the Fed can therefore raise the rate without breaking the economy.
A hawkish mood immediately returned to the market. The Bitcoin price plummeted, but the previous resistance now acted as support. The level held us, and the rate entered the weekend around $79,600. It stayed there for almost all of Saturday until the evening, when more news came from the Strait of Hormuz about attacks on tankers. For us, this meant a slight increase to $80,000, where we are currently located. Volumes remain relatively weaker over the weekend.
Four-Hour Chart Stays in an Uptrend
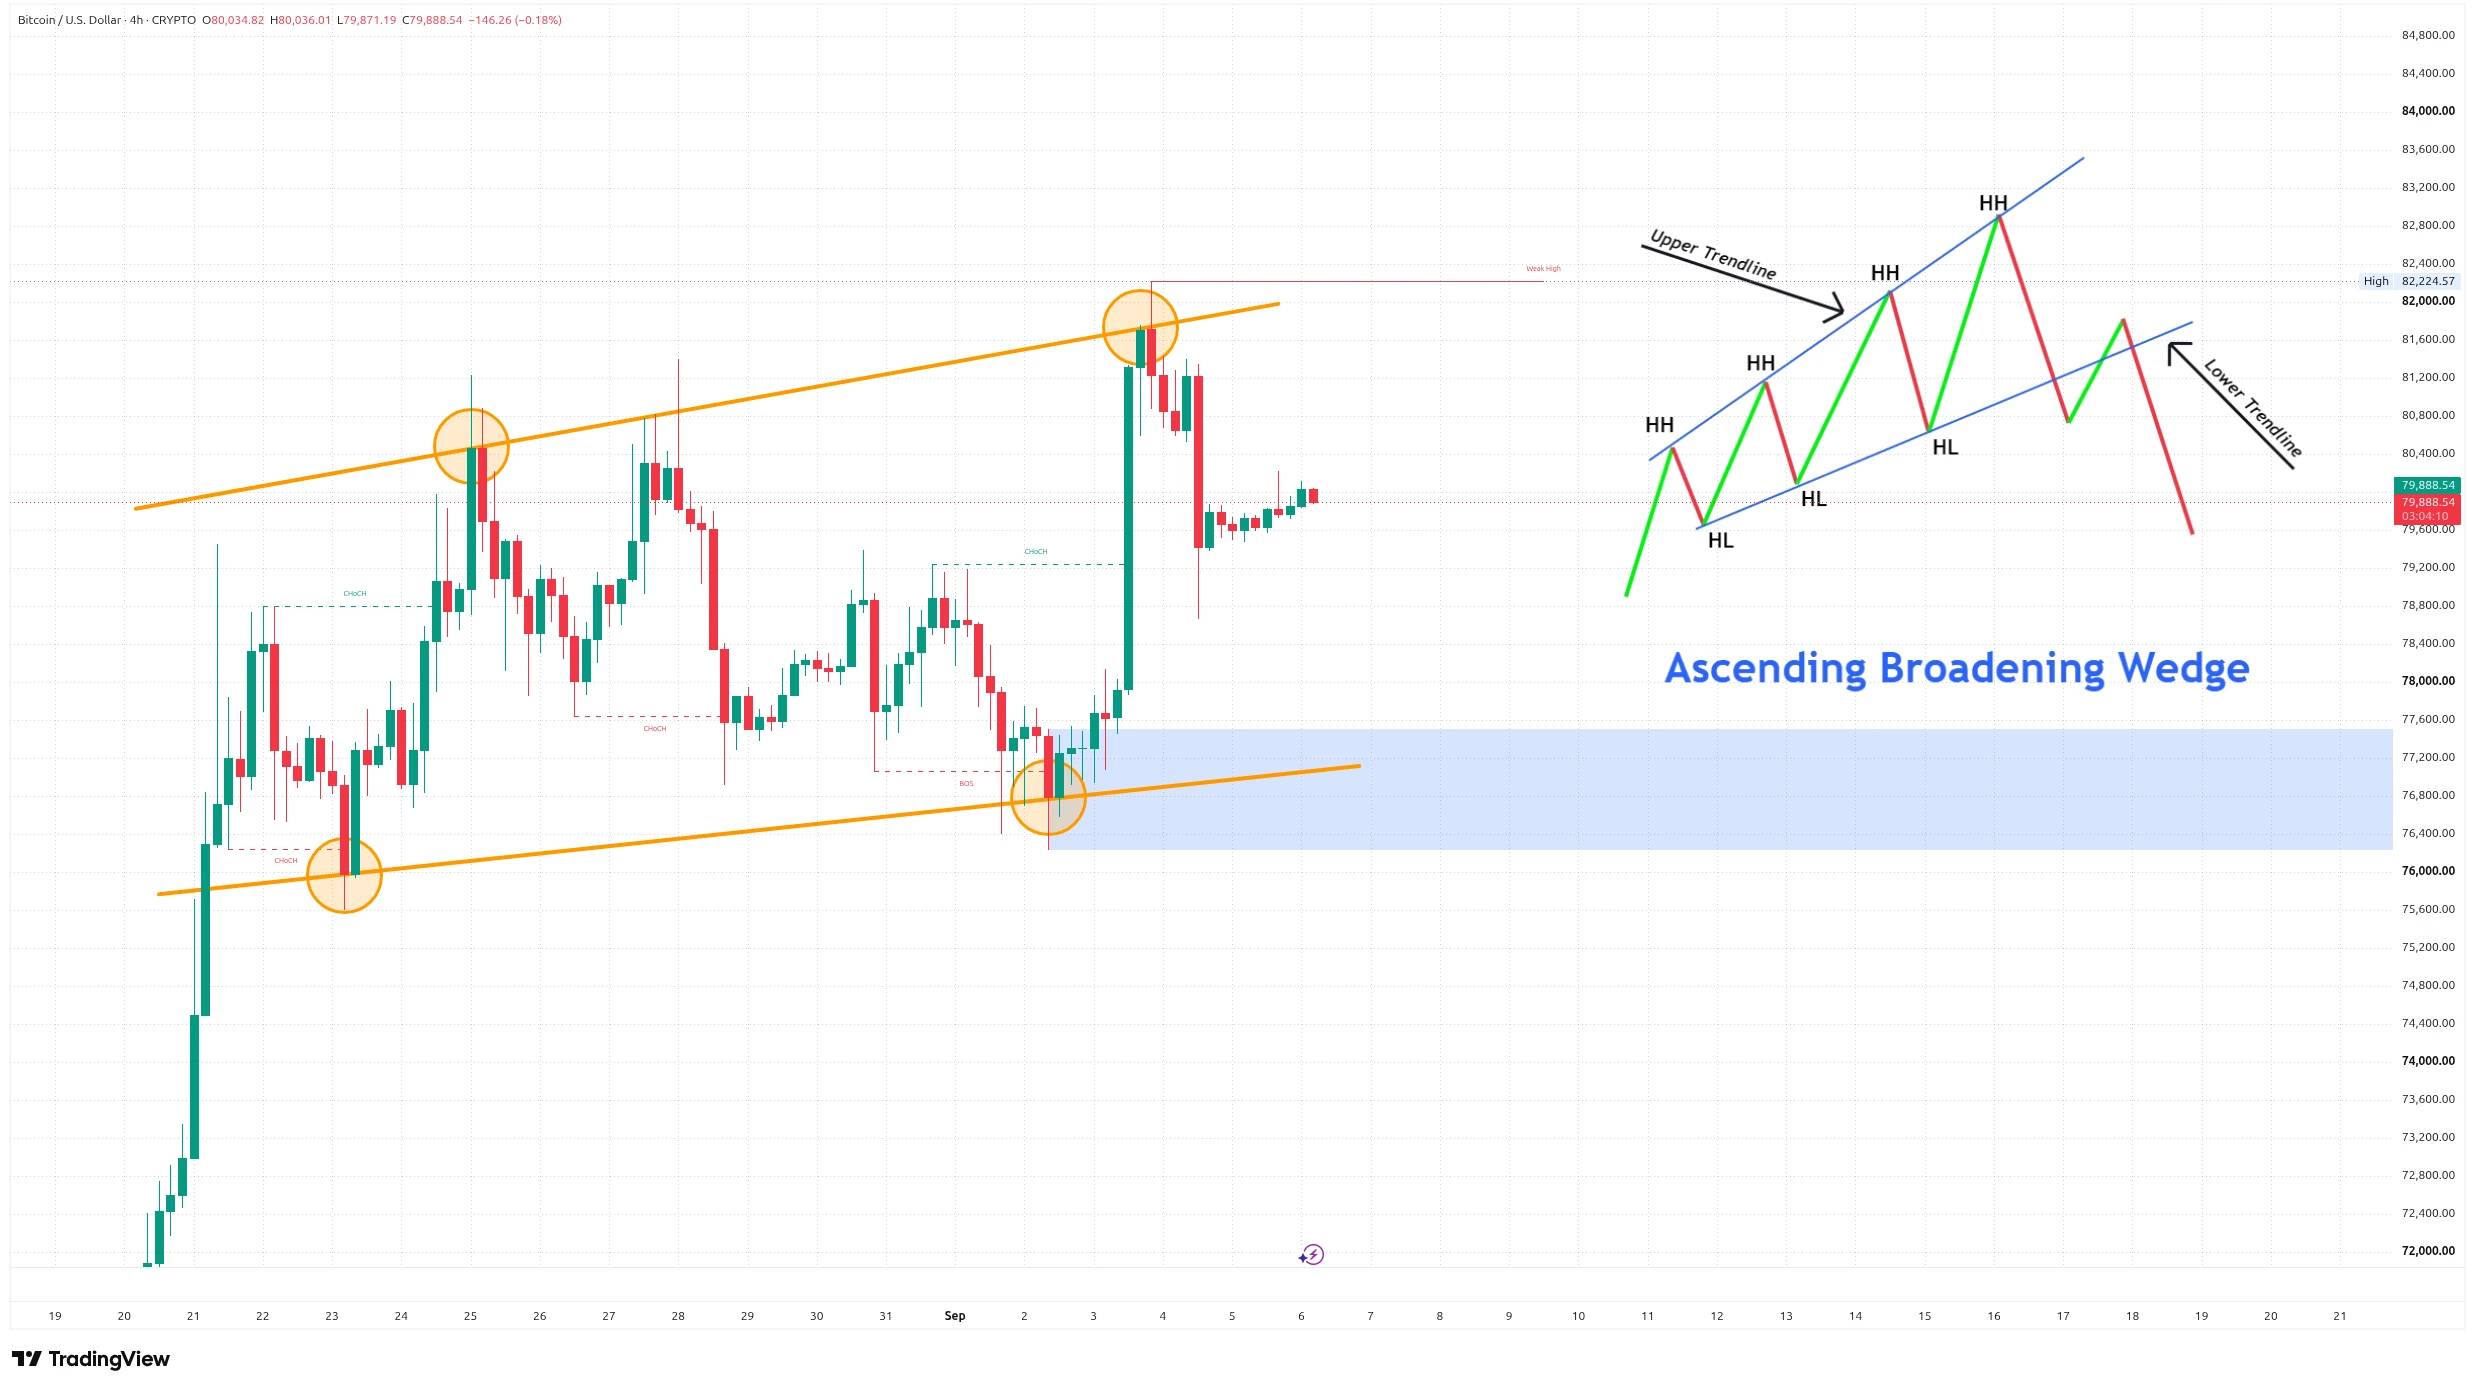
On the four-hour chart, we see that we are still in an upward trend – forming higher highs and higher lows. The upper line is rising faster than the lower one, which could favor an Ascending Broadening Wedge pattern, which is usually interpreted as a bearish formation. However, we only have two touches with the trend lines so far, so I am not clinging to this pattern yet.
Important points for monitoring sentiment:
- Bullish sentiment: Continuation of the higher highs and higher lows trend.
- Warning signal (ChoCH): If the candle drops below $78,650.
- Bearish signal: A breakout below the lower trendline and the formation of lower highs.
From a Smart Money Concepts (SMC) perspective, orders are accumulating above the peaks and below the bottoms, which will act as a magnet for the price.
Daily Chart Still Sending Bearish Signals
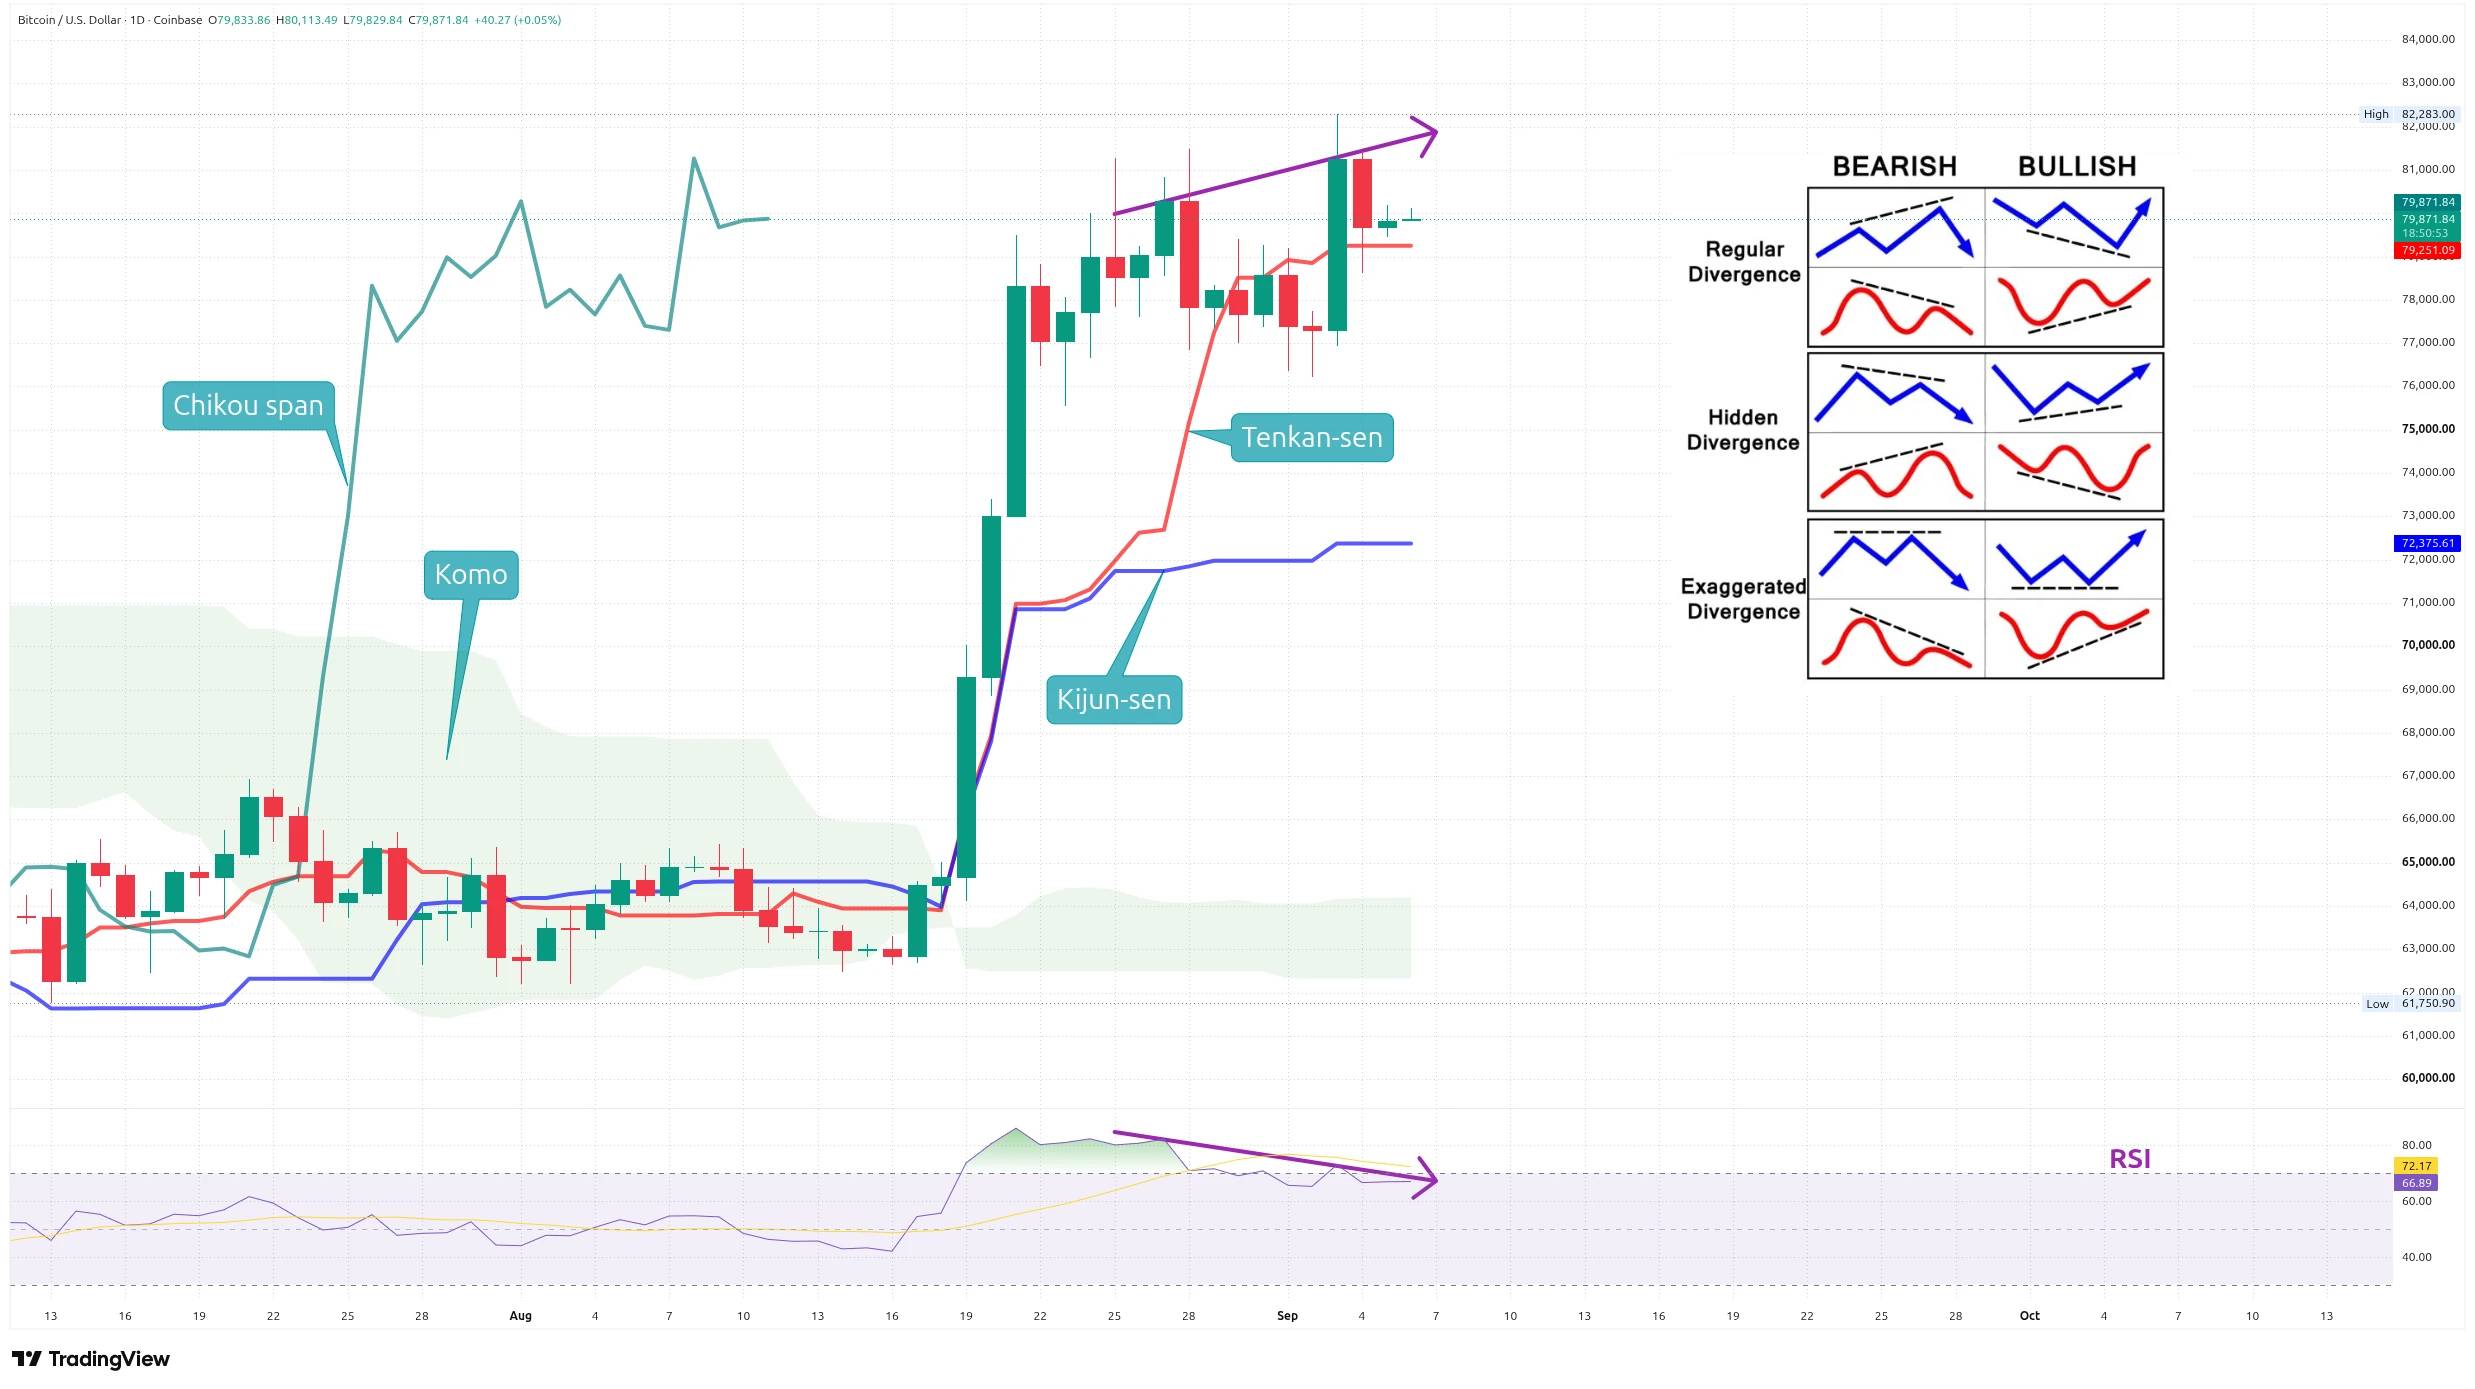
Last week, a potential bearish divergence appeared on the chart. It hasn't played out yet, but it still persists. The price chart is looking for higher highs, but the RSI continues to fall. Although it is no longer in the overbought zone, its value is still not far off.
The Fed meeting is approaching, and inflation numbers, which the United States is scheduled to report on Friday, will be a very significant factor. According to the Chikou span position, we still have bullish sentiment in the market. It would be positive to test the short-term price trend (Tenkan-sen at $79,250) and confirm it as support.
However, we see that the medium-term price trend (Kijun-sen at $72,375) is quite deep below us. This often happens during impulse rallies. I am still watching that bearish divergence, which is a strong warning from a technical analysis perspective on the daily chart.
Weekly Chart Testing Moving Averages
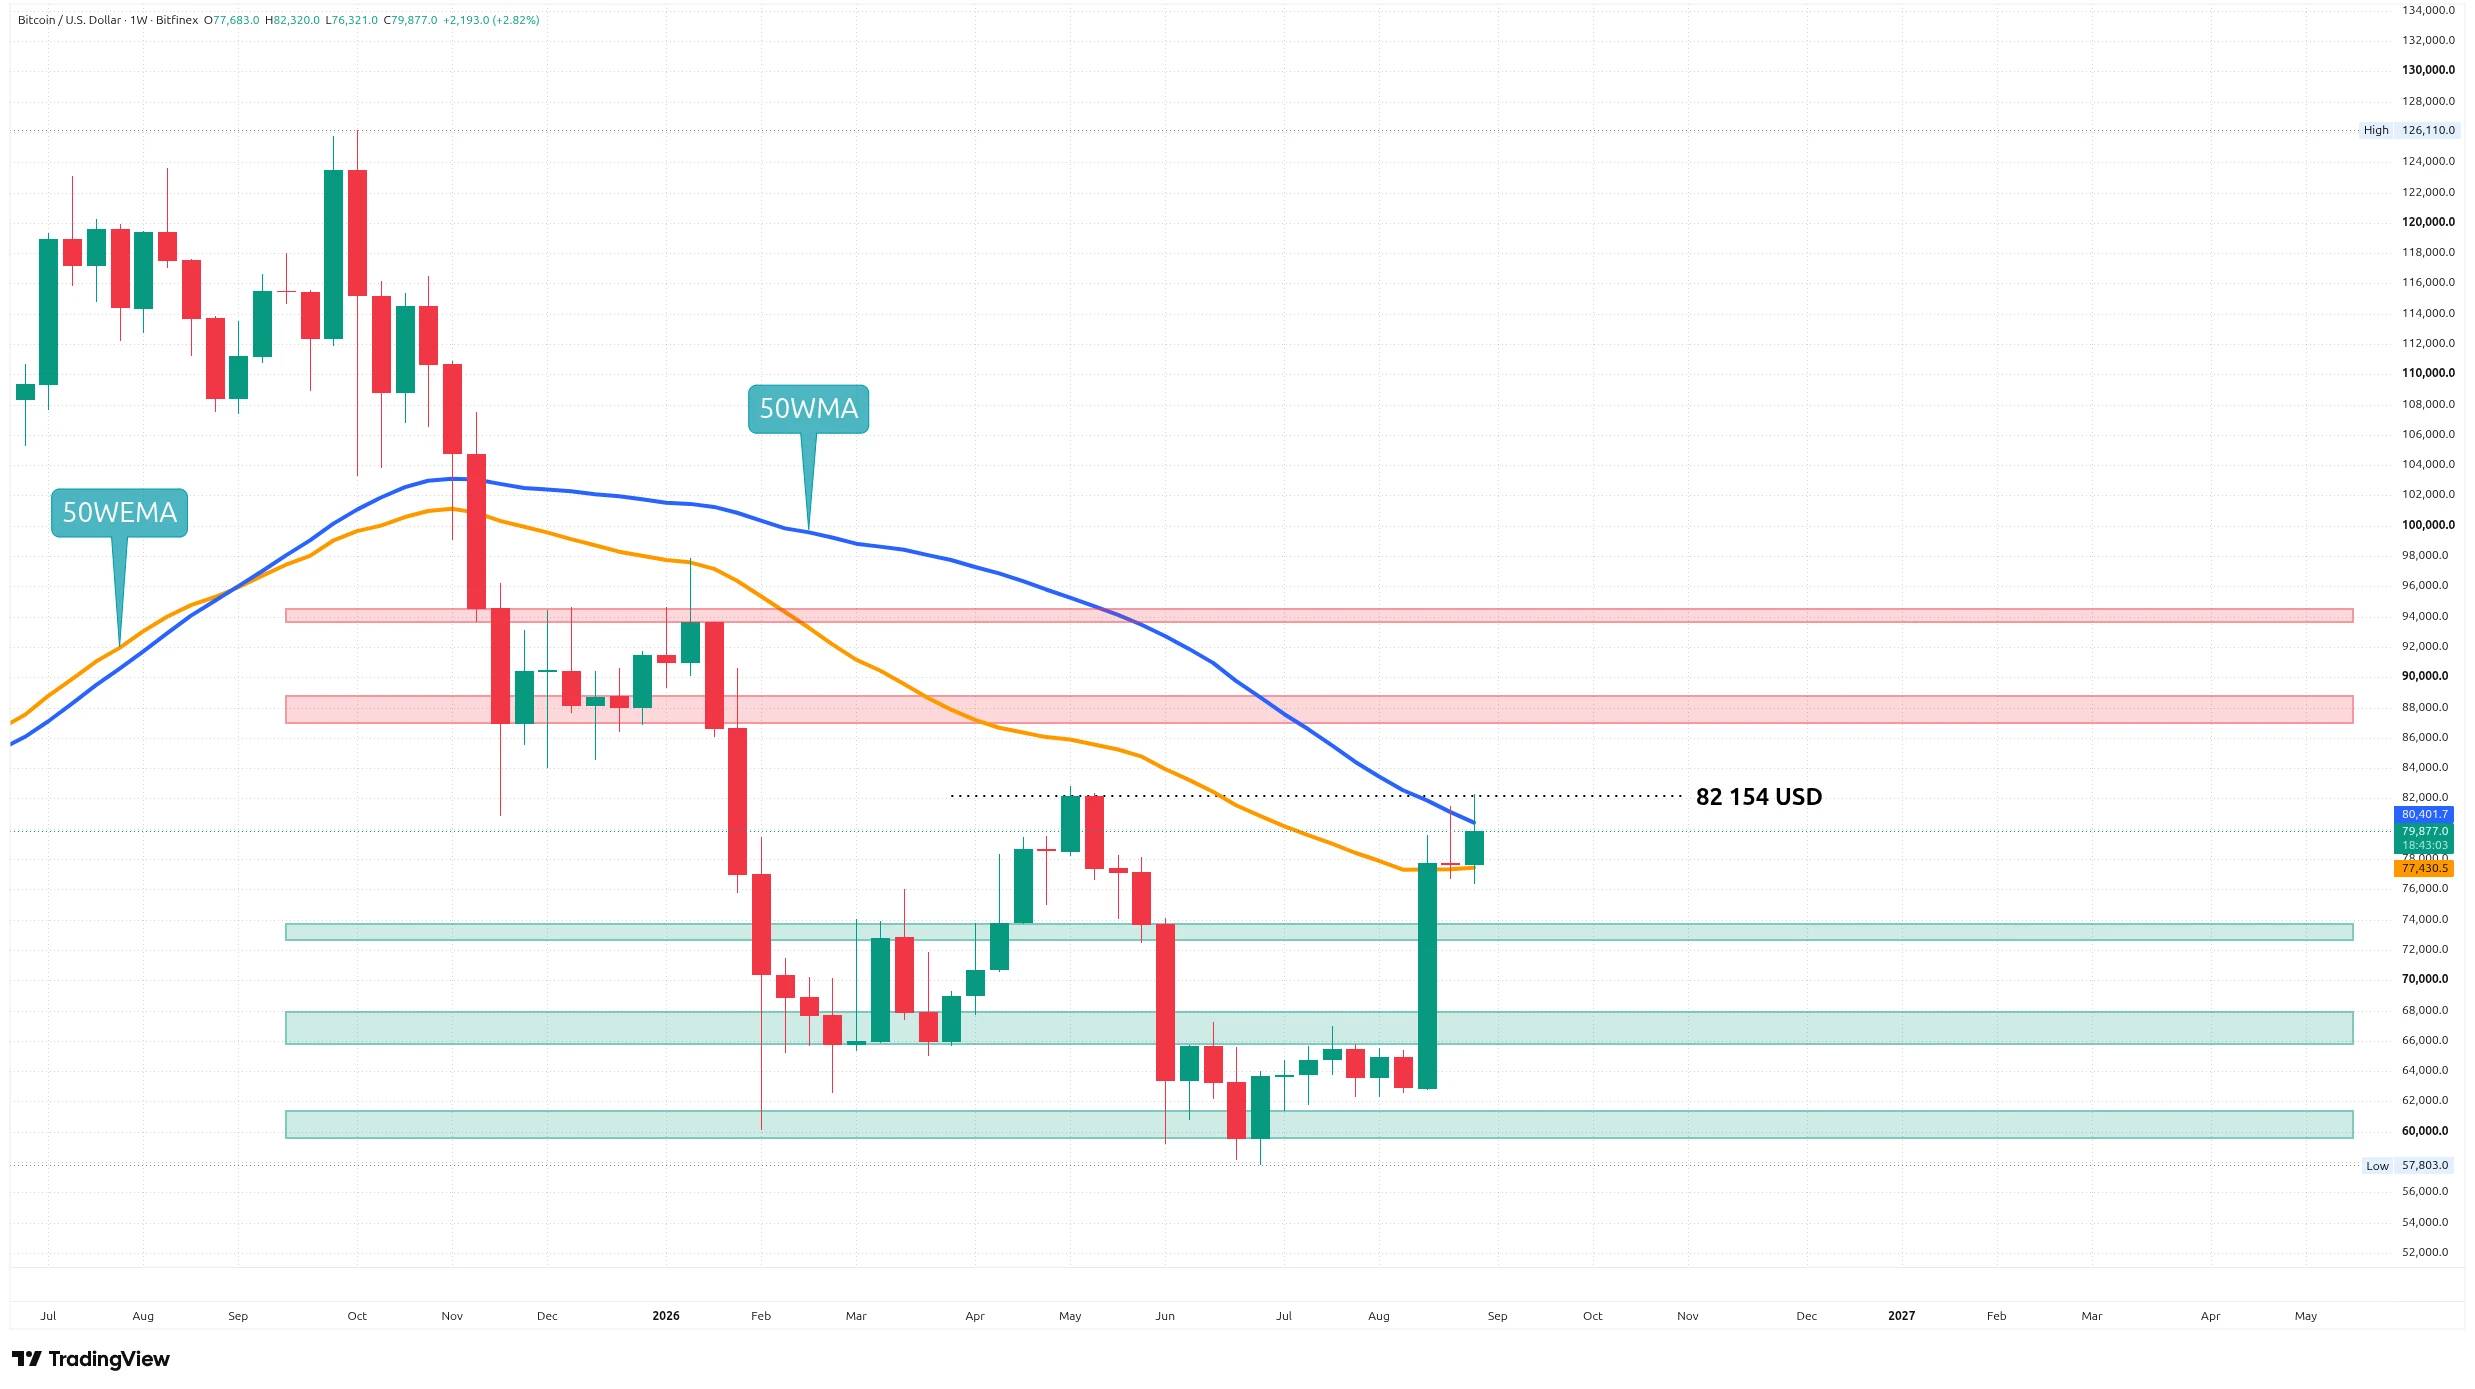
On the weekly view, the supports and resistances from last week still hold. There was a test of resistance in the form of the 50-week moving average (50WMA), while the 50-week exponential moving average (50WEMA) acts as support. We are currently locked between these two levels.
Key level: To cancel the downward trend and start a real bull market, we need to close a weekly candle above the $82,154 level. According to statistics, this trend should arrive sometime in early October.
What is the Current State of the Market?
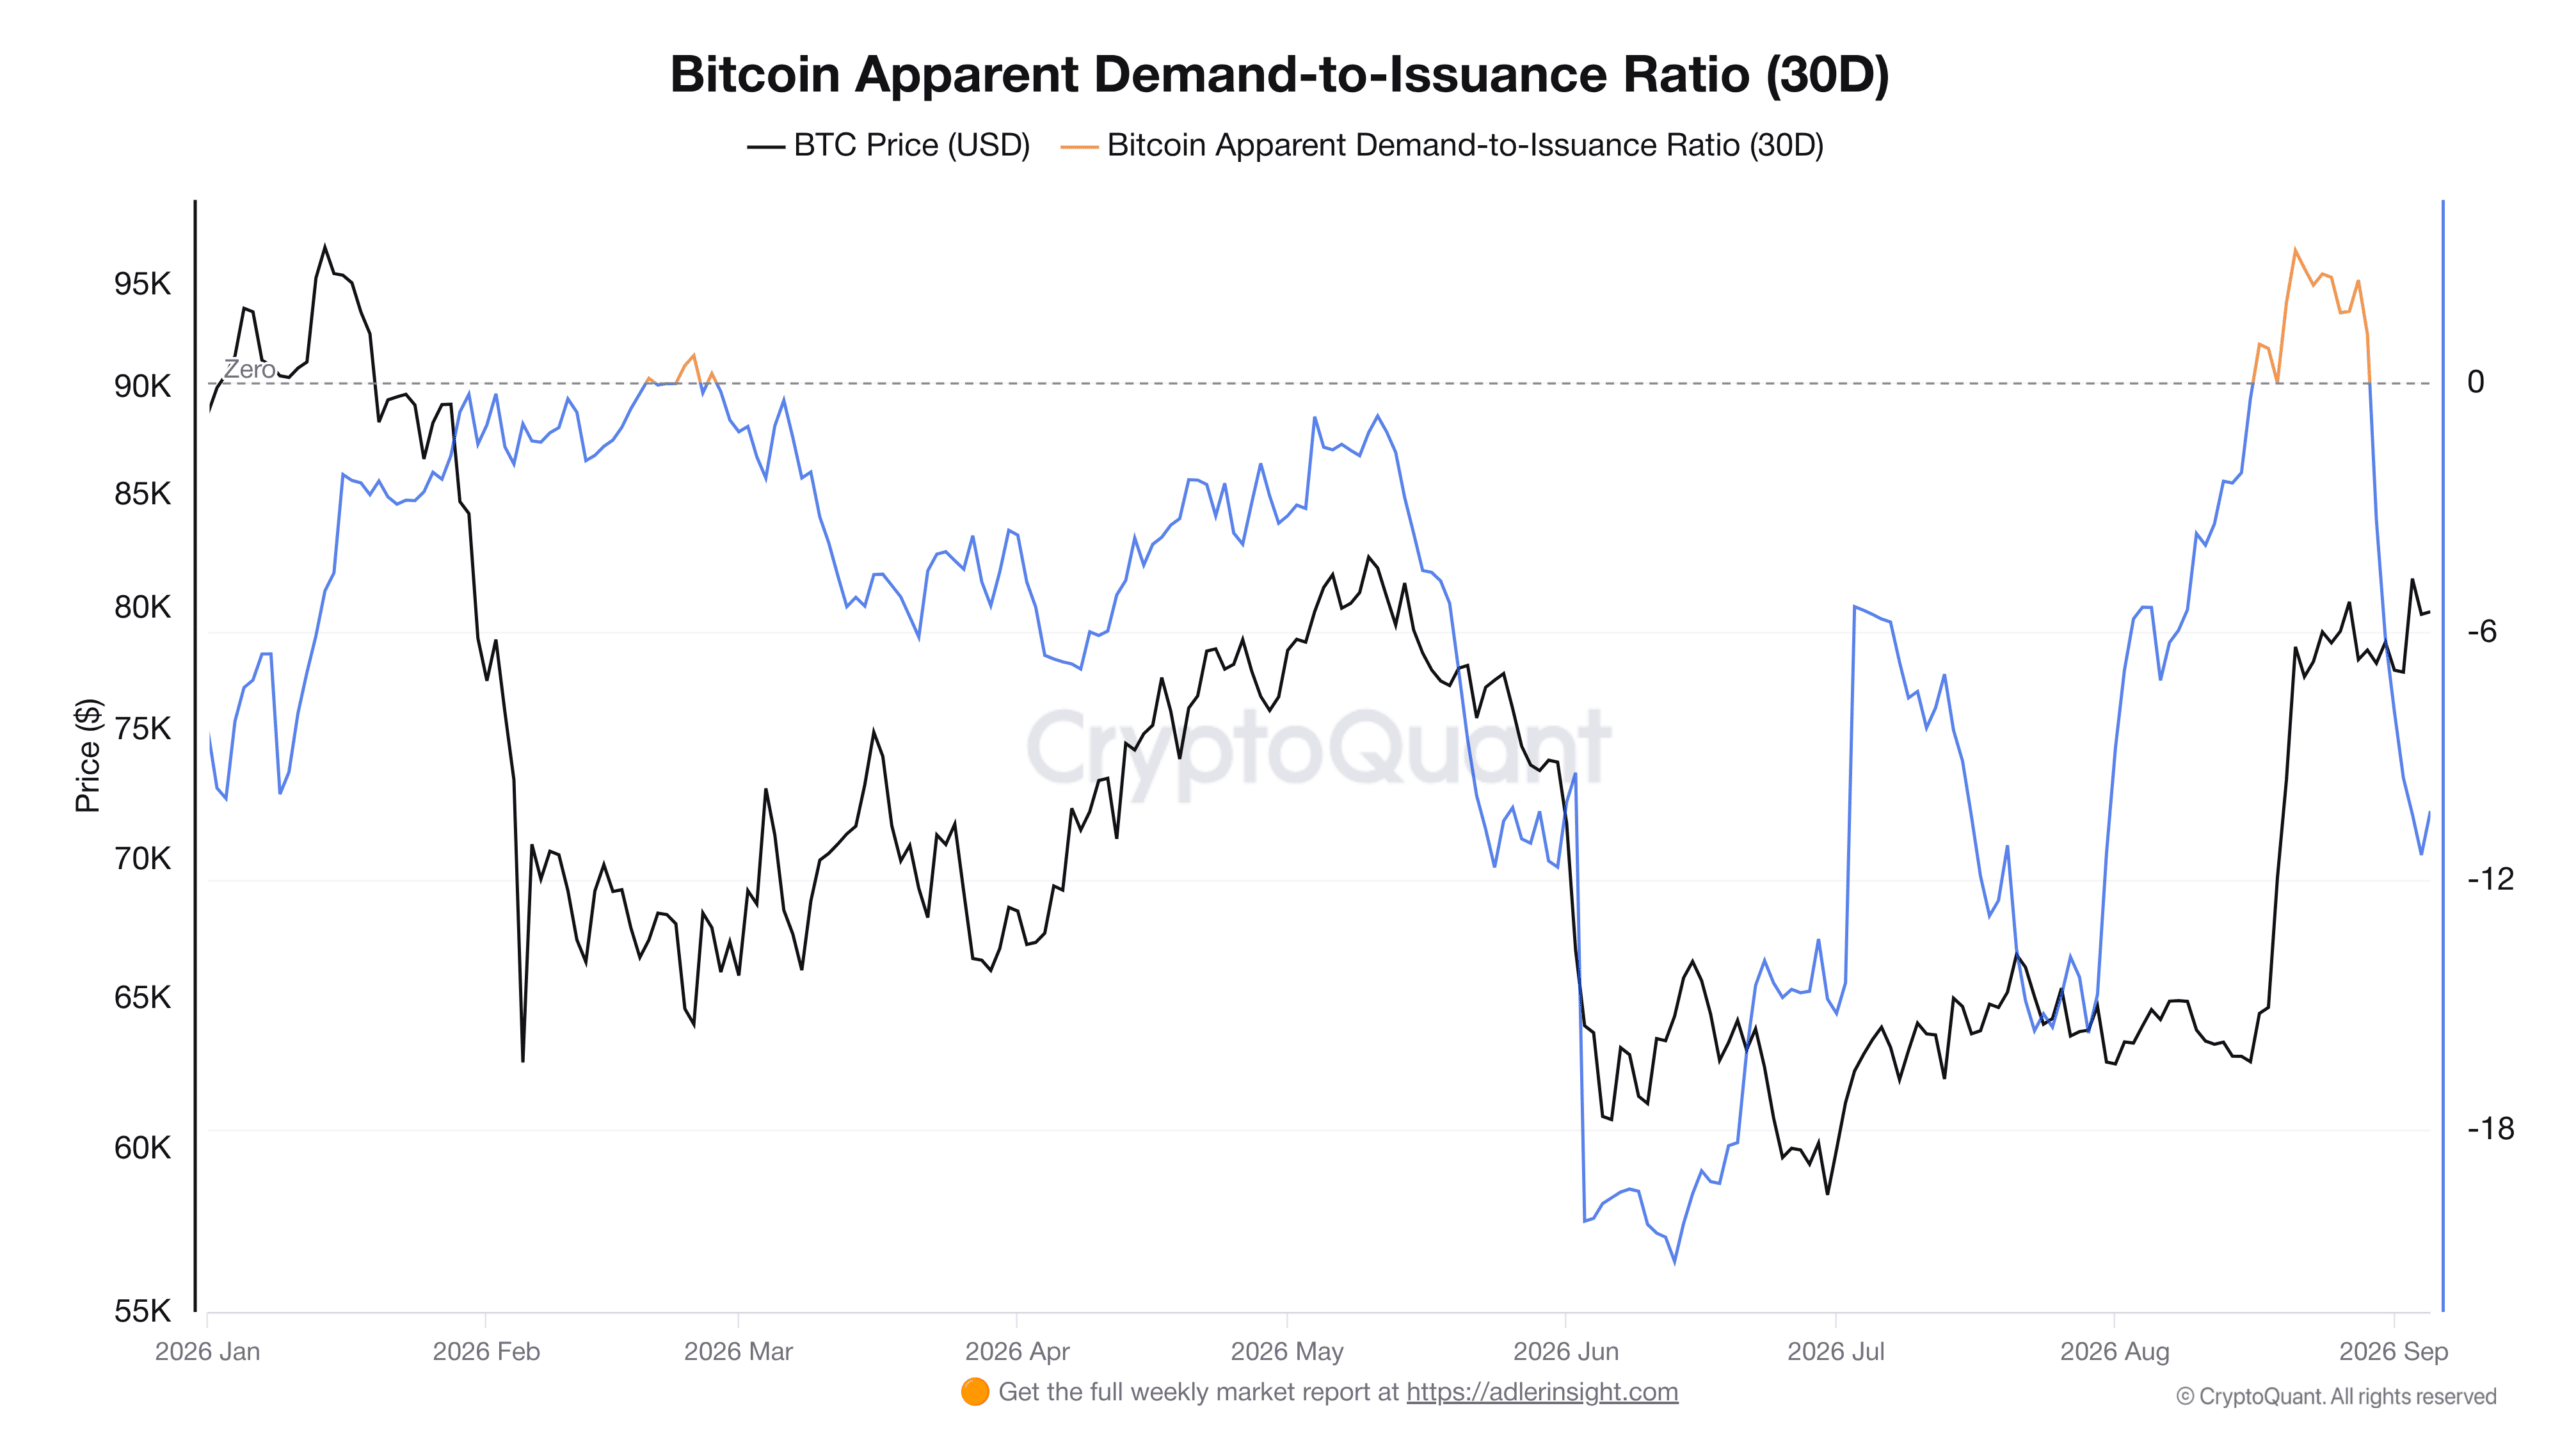
The relationship between demand versus new supply can be observed. Miners mine approximately 450 new BTC per day. If more coins are bought in that day, we have higher demand, which should lead to a higher price. Recently we saw growth into positive numbers, but a slight decline followed again.
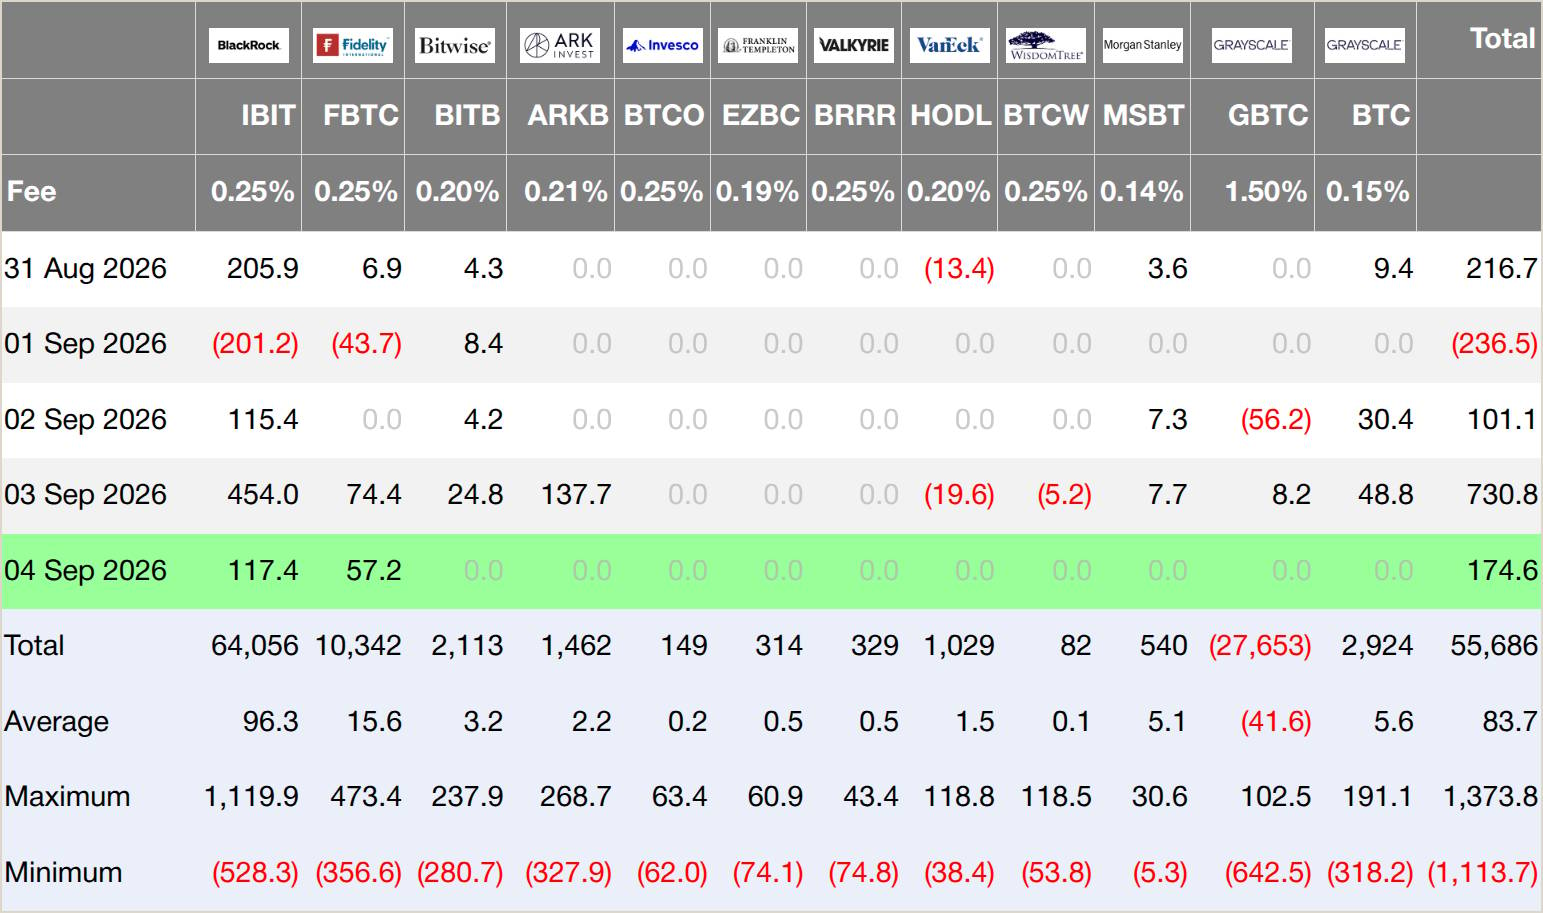
During the last rally, we were primarily pulled up by spot exchange-traded funds (ETFs). This week they recorded an increase of nearly a billion dollars. The strongest day was Thursday with an increase of over $730 million, which was the third-highest result since the beginning of the year.
Situation Among Professional Traders
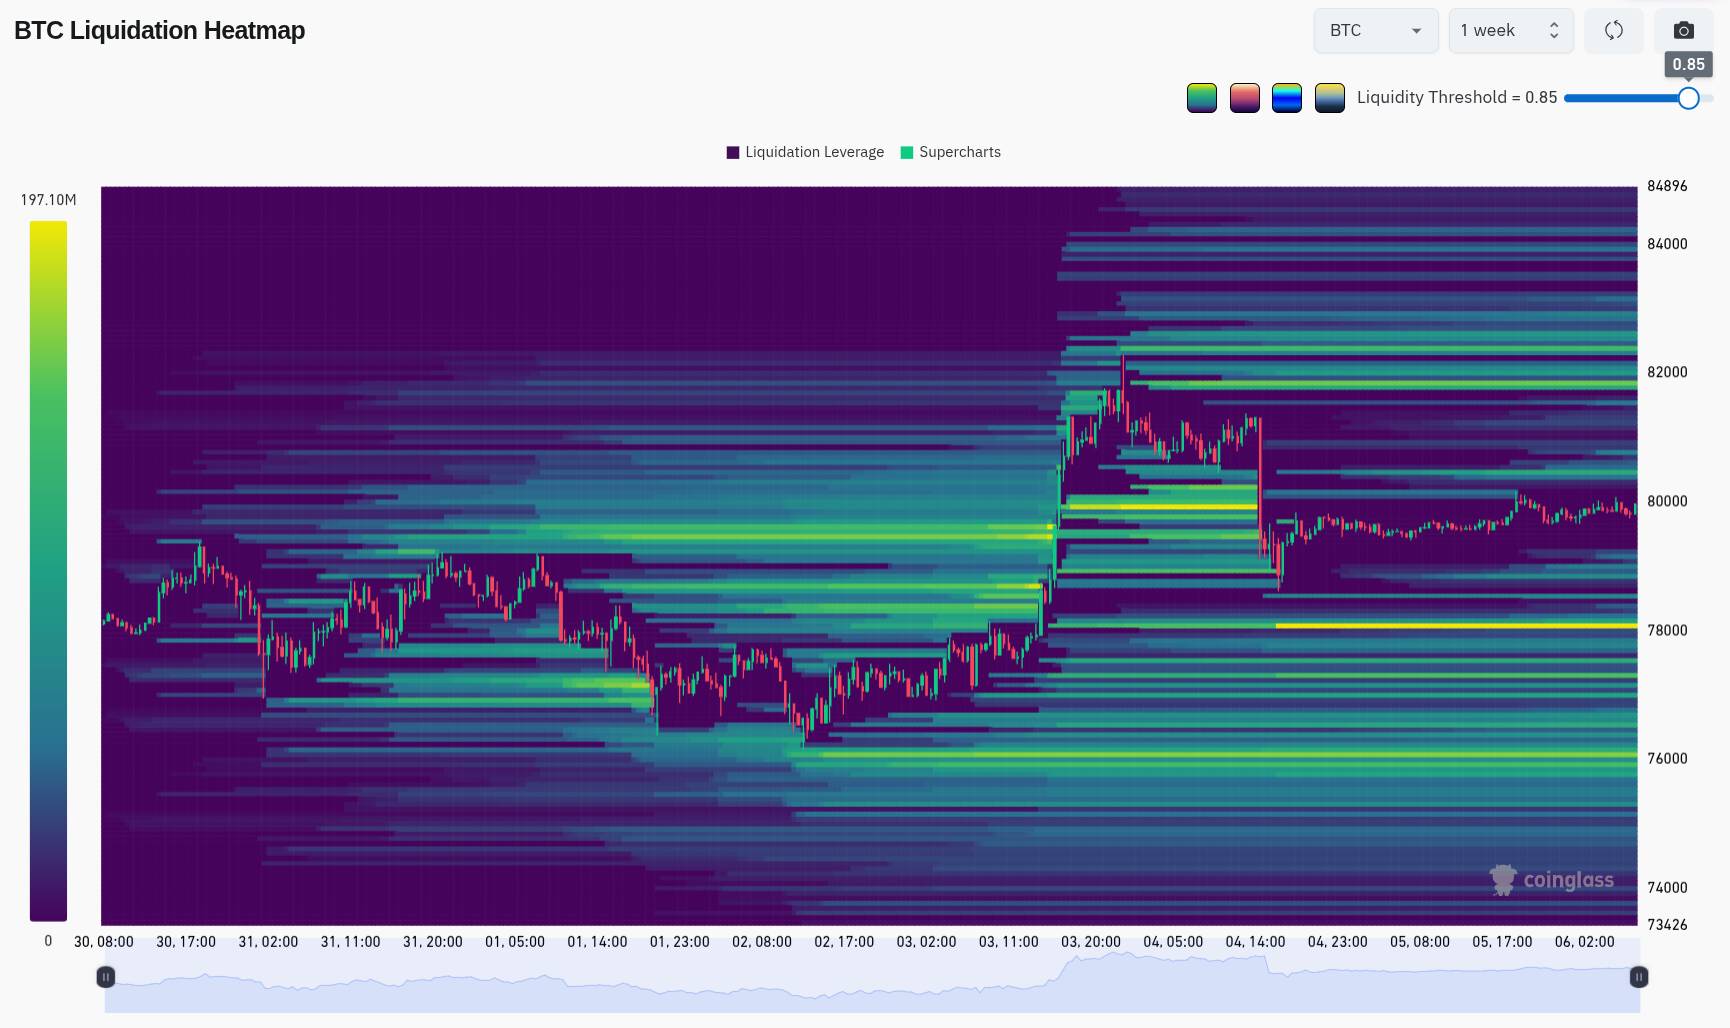
I monitor the derivatives market to see if demand is increasing. The weekly liquidity map shows that on Friday, the rate returned to pick up the $79,936 level, where there were over $195 million in long positions. Liquidations in a single hour reached nearly a quarter of a billion dollars.
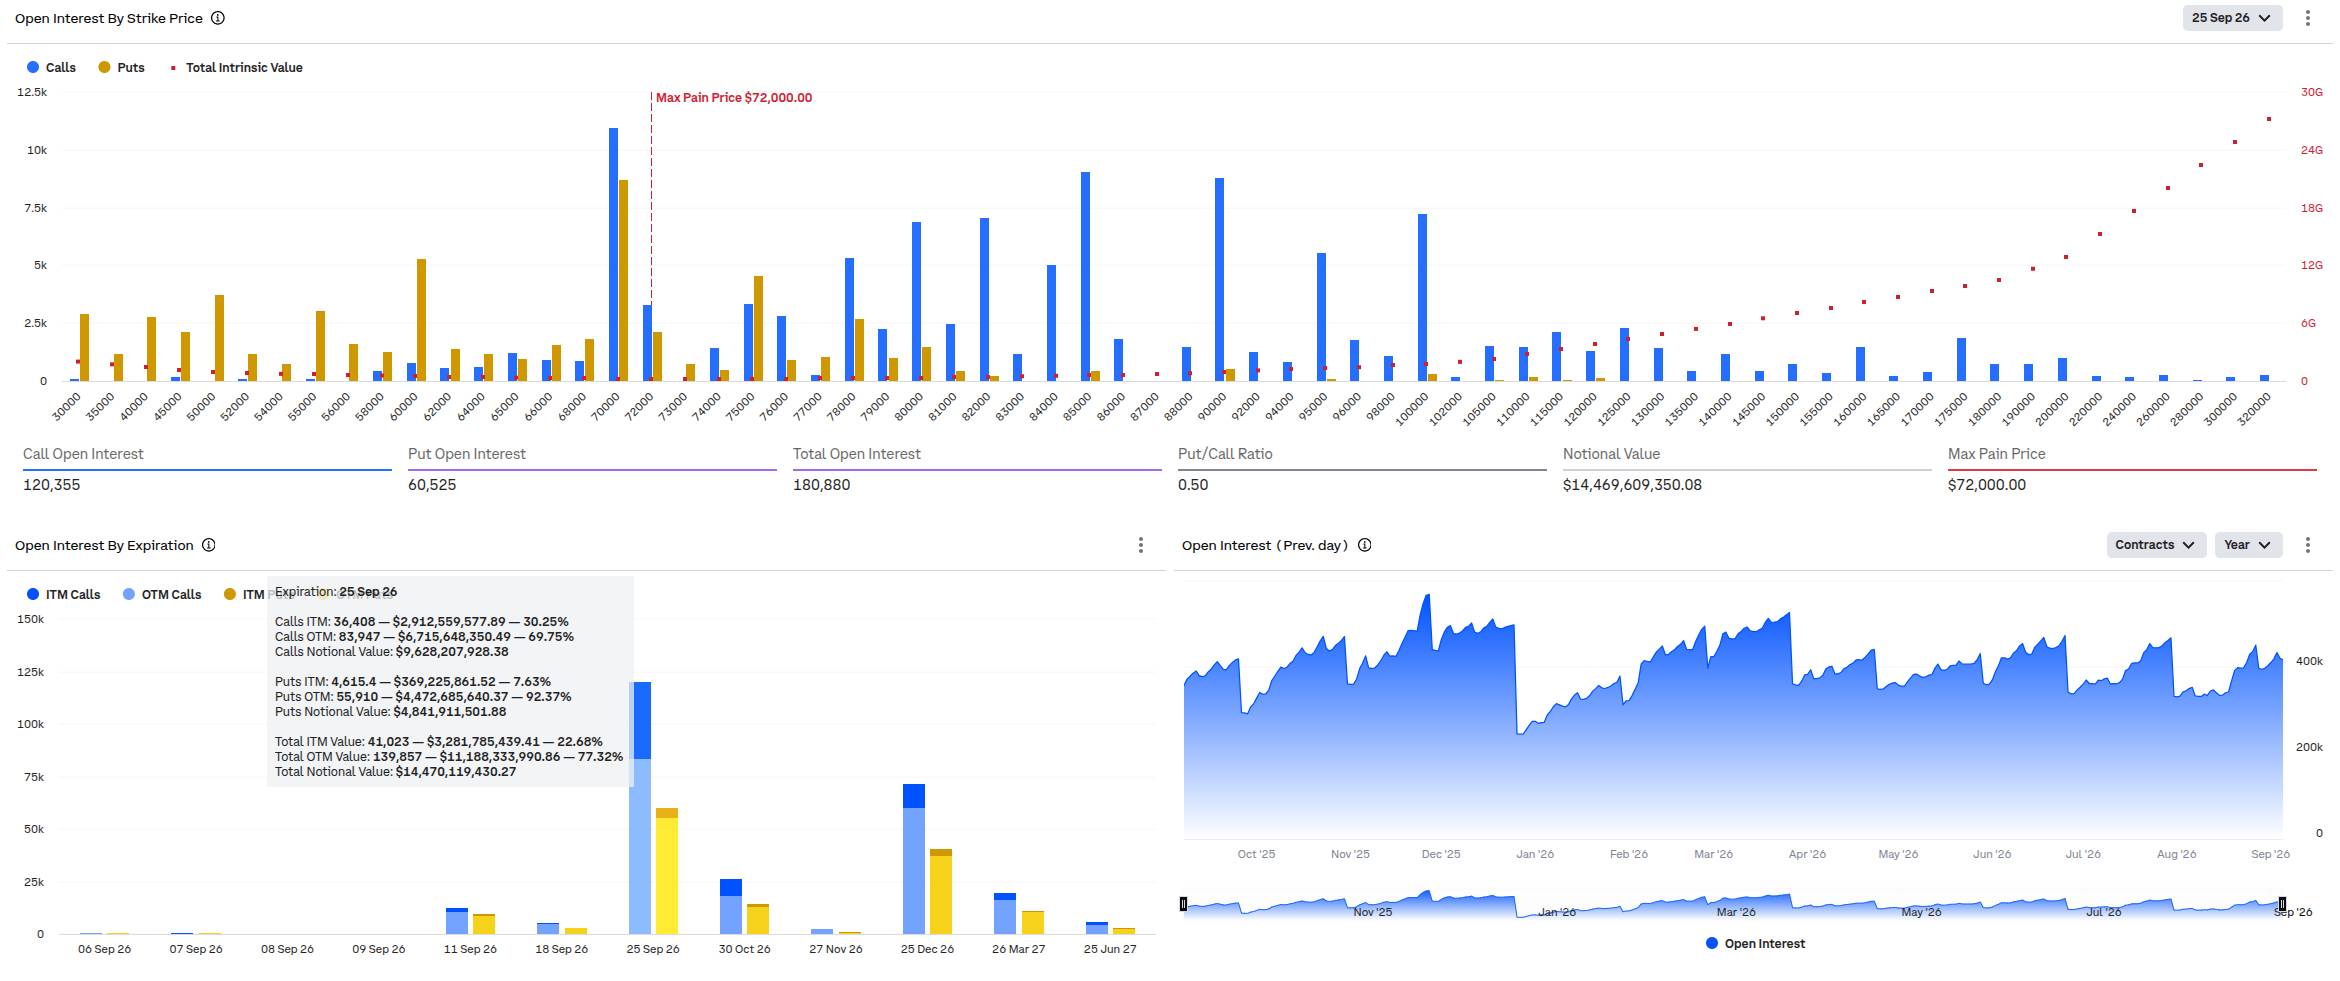
Now, more long positions are opening with liquidation around $78,076. The Bitcoin rate is often attracted to these levels. Also interesting is the development in options, where the Max Pain Price shifted to $72,000 with a total contract volume of $14.47 billion for the end of September.
What Do Popular Analysts Think?
Ash Crypto: Sees the current growth as confirmation of the cycle bottom and compares the market setup to the bounce in 2022.
The 2022 cycle bottom confirmed a bounce above the 2017 market peak. We’re seeing the same setup again.
Bitcoin Intelligence: Warns that the rejection at $82,000 confirmed the end of the bull trap and expects a drop to $53,000 before the real growth begins.
BITCOIN JUST CONFIRMED THE BULL TRAP IS OVER. I told you to long $BTC around $58K and take the short near $82K. $79K → $70K → $62K → $53K → NEW BULL RUN.
Ted Pillows points to a historical correlation where a daily ETF increase of over $700 million was often followed by a local peak. Conversely, Bitcoin Historian quotes Matt Hougan, who believes in a return above $100,000 yet this year.
What Awaits Us Next Week?
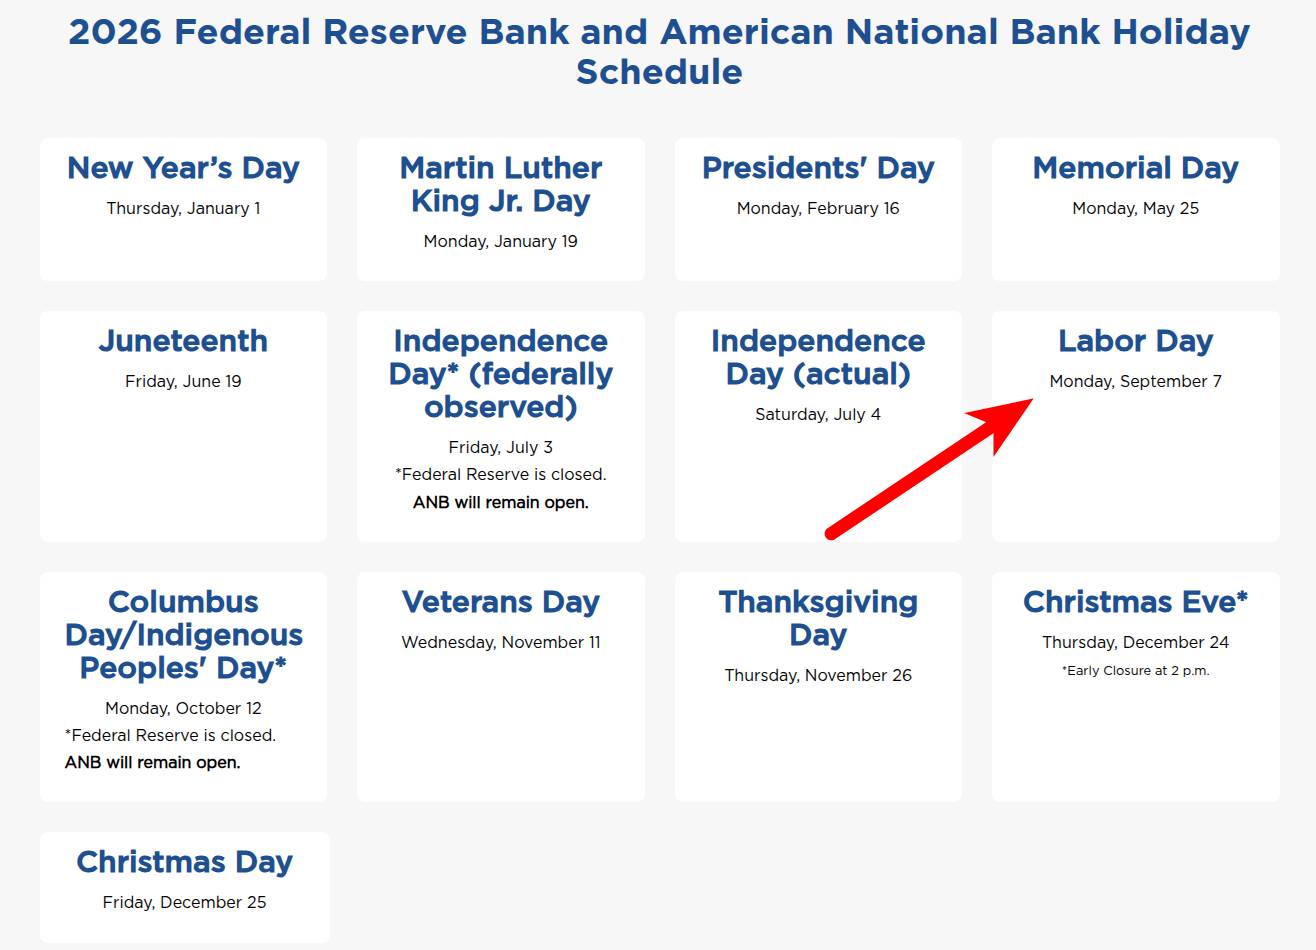
We are strongly under the influence of the US economy. First important fact: Monday is a holiday in the USA (Labor Day), so exchanges will be closed and lower volumes are expected. Volatility is likely to increase on Thursday and Friday:
- Thursday (14:30): Producer Price Index (PPI) release.
- Friday (14:30): Headline and Core Consumer Price Index (CPI) release. Expected level is 3.4%.
To this, we must add geopolitical factors – the ongoing conflict in the Strait of Hormuz and negotiations regarding the situation in Ukraine, which may bring unexpected news.

Where Could Bitcoin Go Next?
From a technical analysis perspective, we are maintaining an upward trend, but the bearish divergence on the daily chart is a warning. The short-term support at $79,250 is key; if it is broken, a slide down to $72,375 could follow.
Scenarios for further development: 1. Bullish: Closing the week above $80,400 (50WMA) and overcoming $82,154. 2. Bearish: Breaking supports and testing the area around $72,500, where the Kijun-sen lies.
How Will I Trade This Week?
During Tuesday's decline, I was buying on spot, but I'm leaving derivatives closed. The market is very much about emotions right now. I would take the filling of the daily bearish divergence as a return to logical behavior.
I will prepare long positions in the area below $76,000 and spread them down to $72,300. If the price fell below this level, I would take it as a trend break. On the way down, I will monitor sentiment and adjust positions in case of negative fundamental news.
Notice: This entire article expresses only my personal opinion on current market events. It is definitely not investment advice or a recommendation. Always do your own analysis before making your own investment. DYOR.
Crypto, Web3, and technology enthusiast. My portfolio includes cryptocurrencies, stocks, precious metals, crypto derivatives, and NFTs. I primarily make decisions based on technical analysis while considering macroeconomic indicators.