
Bitcoin Surpasses $80,000. Fed, Inflation, and Liquidity Could Still Change Everything
Bitcoin has broken the $80,000 mark and, for the first time since 2021, closed the week above the key 50-week average. Despite the optimistic technical picture, the market is eyeing Fed decisions and inflation data that could complicate further growth.
Bitcoin Breaks Barriers: One of the Strongest Weeks of the Year Behind Us
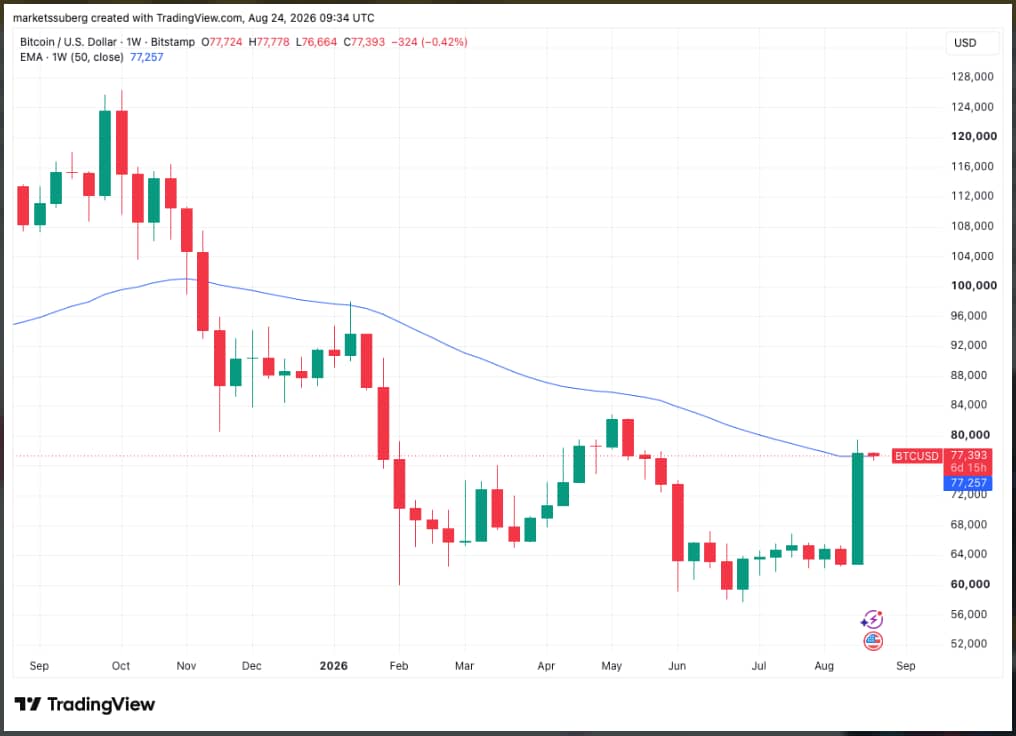
Bitcoin has just completed one of its most successful weeks of the year. In just a few days, its price rose by up to 27%, surpassing the $80,000 mark. However, what is technically even more significant is that for the first time since late 2021, it closed the week above the important 50-week exponential moving average (EMA).
The technical picture of the market has significantly improved with this move, although definitive confirmation of a long-term trend reversal is still missing. Furthermore, macroeconomic factors are aggressively entering the play: actions by the US Fed, inflation trends, the bond market, and the state of global liquidity. The coming days will likely decide whether Bitcoin will continue its growth rally or if the current momentum will stall again.
Bitcoin Overcomes Key Resistance
During the past week, Bitcoin climbed as high as $79,550, representing a local high since the beginning of this May. The market subsequently closed weekly trading at a solid level of $77,727.
Thanks to this move, the price successfully moved above the 50-week exponential moving average (EMA), which was located approximately at $77,257 at the time. This technical indicator is of fundamental importance, especially during bear market periods. The last time the largest cryptocurrency managed to close a week above this threshold was in early November 2021.
The current price action is much more significant than just breaking one technical level. Bitcoin has fought its way above resistance that has decided the future direction of the entire market several times in the past.
Is the Bear Market Truly Over?
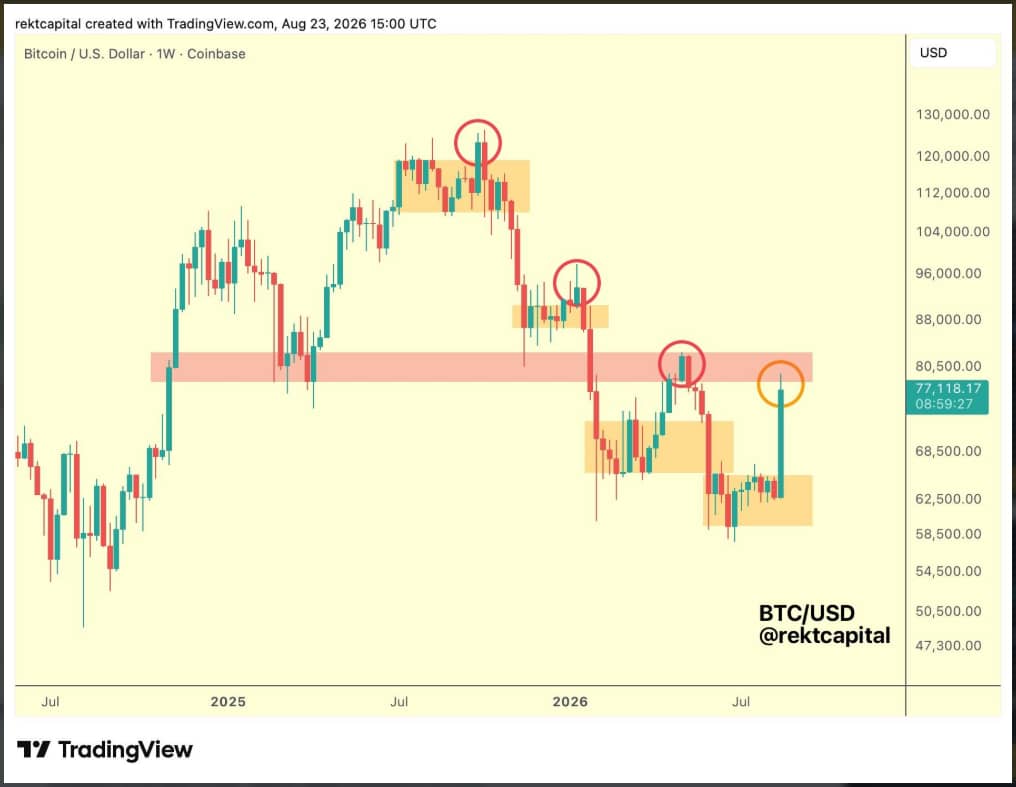
However, strong price growth does not automatically mean that Bitcoin has definitively transitioned into a new bull trend. A well-known analyst using the pseudonym Rekt Capital points out that the area around $80,000 remains a major obstacle for buyers. History shows that in previous downtrends, Bitcoin often corrected significantly in the following week after a similarly sharp surge.
It will be crucial to monitor market behavior after this initial breakout. If Bitcoin can reliably overcome and maintain the area above $80,000, the overall technical picture will improve dramatically. Conversely, a quick return below this level could signal that it was just another short-term relief rally within a broader downward trend.
Best August Since 2017
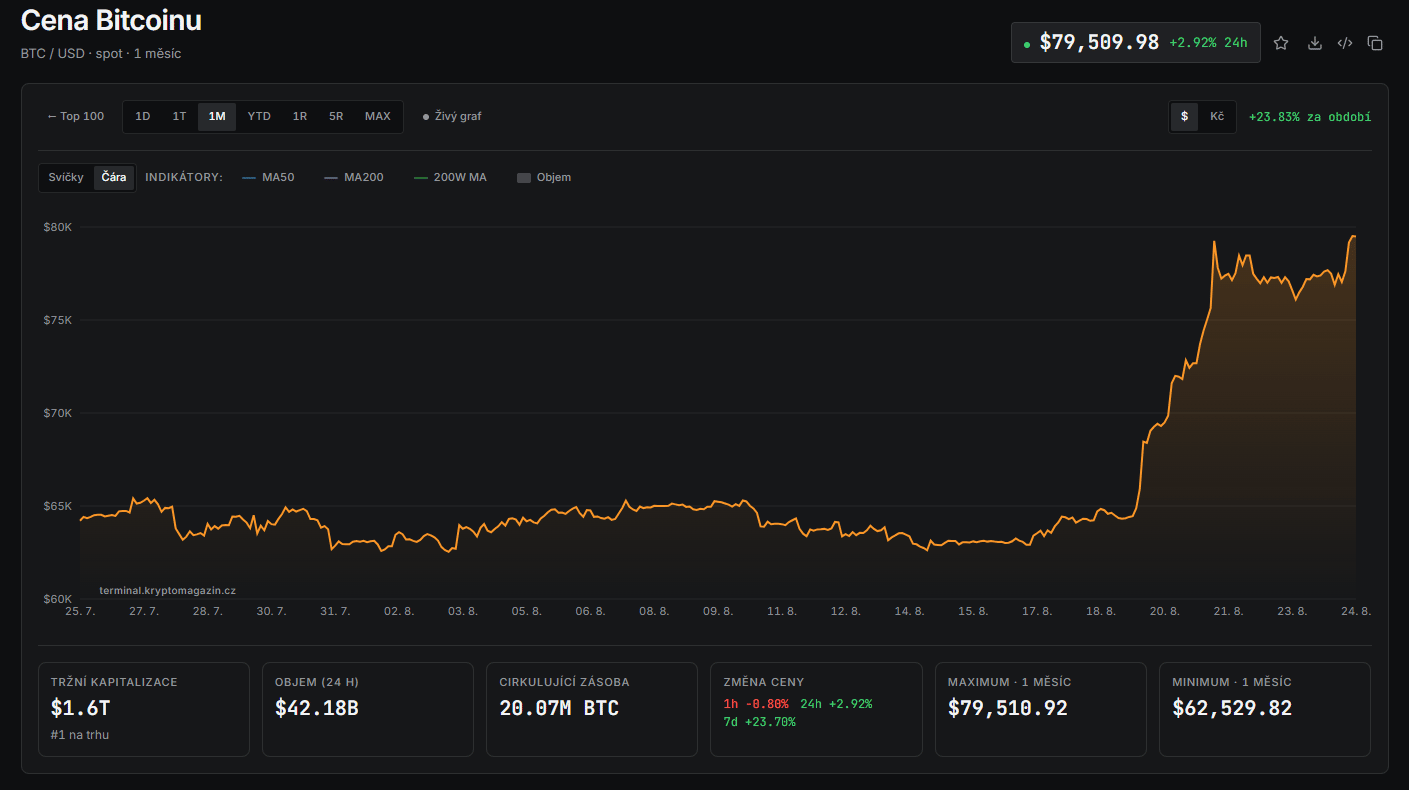
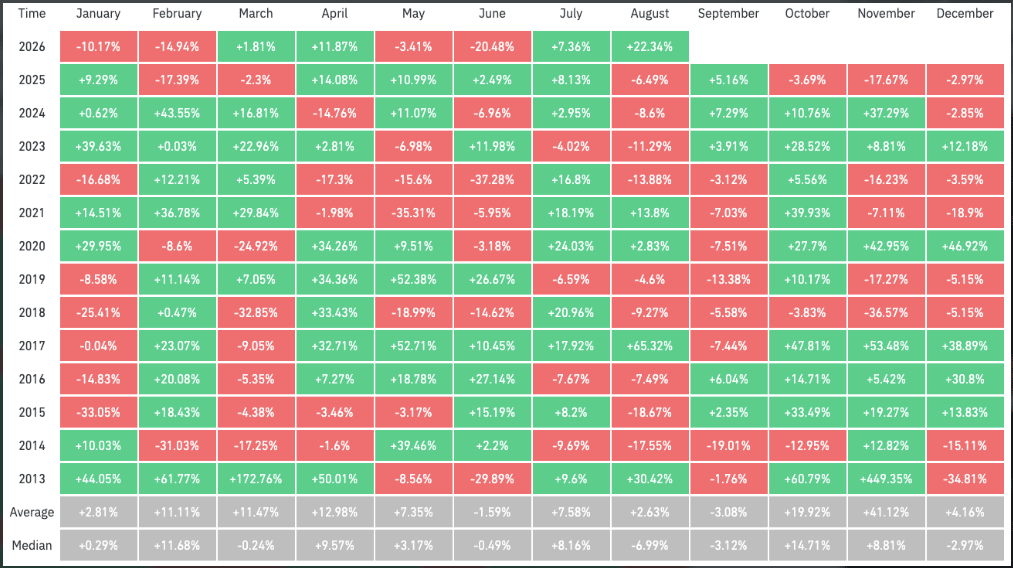
Despite the risks, current statistics are exceptionally strong. Bitcoin stabilized around $77,500 over the weekend and recorded a gain of approximately 22% for the entire month of August. If it maintains this result, it will be the best August performance since 2017.
During its rise, Bitcoin surpassed several important milestones. One of the most significant was the average purchase price of short-term holders, which currently sits around the $68,700 level. This group of investors (holding coins for less than 155 days) is a key indicator of whether the market is truly recovering from previous drops.
Most of the Market is Back in Profit
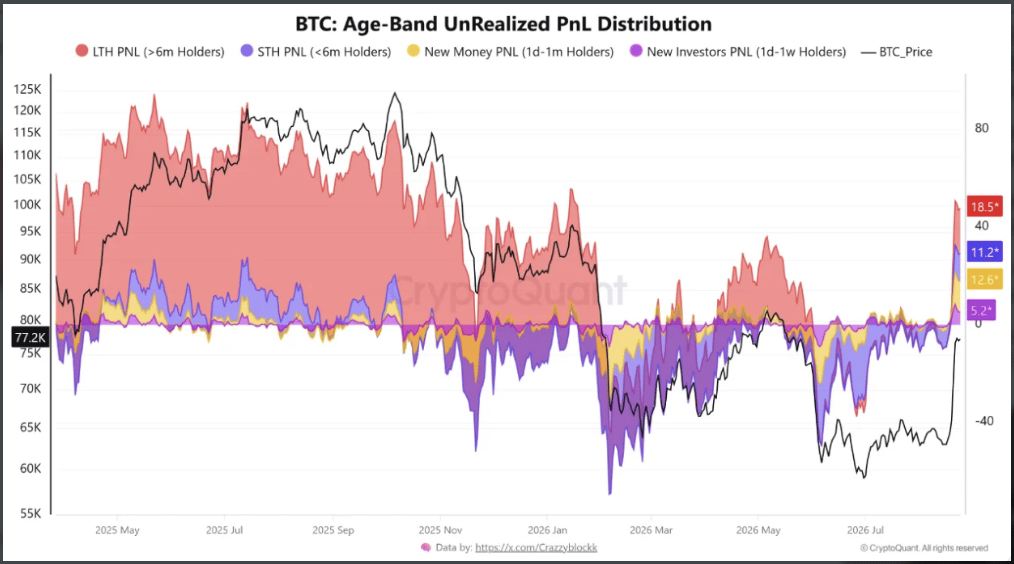
Analysis from CryptoQuant shows that the profitability of short-term holders is now hovering just above the 11% mark. Even more interesting is the view of long-term holders, whose profitability jumped from the freezing point to a solid 18.5%.
So-called "new capital"—money that entered the market only recently—also saw a significant recovery. According to the data, their position changed from a loss of -1.4% to an impressive profit of +12.6%.
The current price increase is not just the result of empty speculation, but reflects a real improvement in financial positions across all major investor groups.
The Zone Between $68,000 and $73,000 as a Key Pillar
However, analysts from CryptoQuant also point to a potential risk. Brand new capital has its break-even point only around the $73,000 level, which is substantially higher than for most other holders. This means that the space for a "safe" price drop has narrowed. If Bitcoin were to sharply reverse direction at current levels, the newest buyers would very quickly find themselves in the red.
For this reason, attention is focused on the critical zone between $68,000 and $73,000. If Bitcoin maintains this area as strong support, the current improvement in profitability will gain much more stable foundations.
Macroeconomics: Jackson Hole and Kevin Warsh's Appearance
Macroeconomics will also have its say this week. The annual symposium in Jackson Hole will attract enormous attention from the financial world, where prominent Federal Reserve (Fed) representative Kevin Warsh will speak. This will be his first major public appearance since the July FOMC meeting.
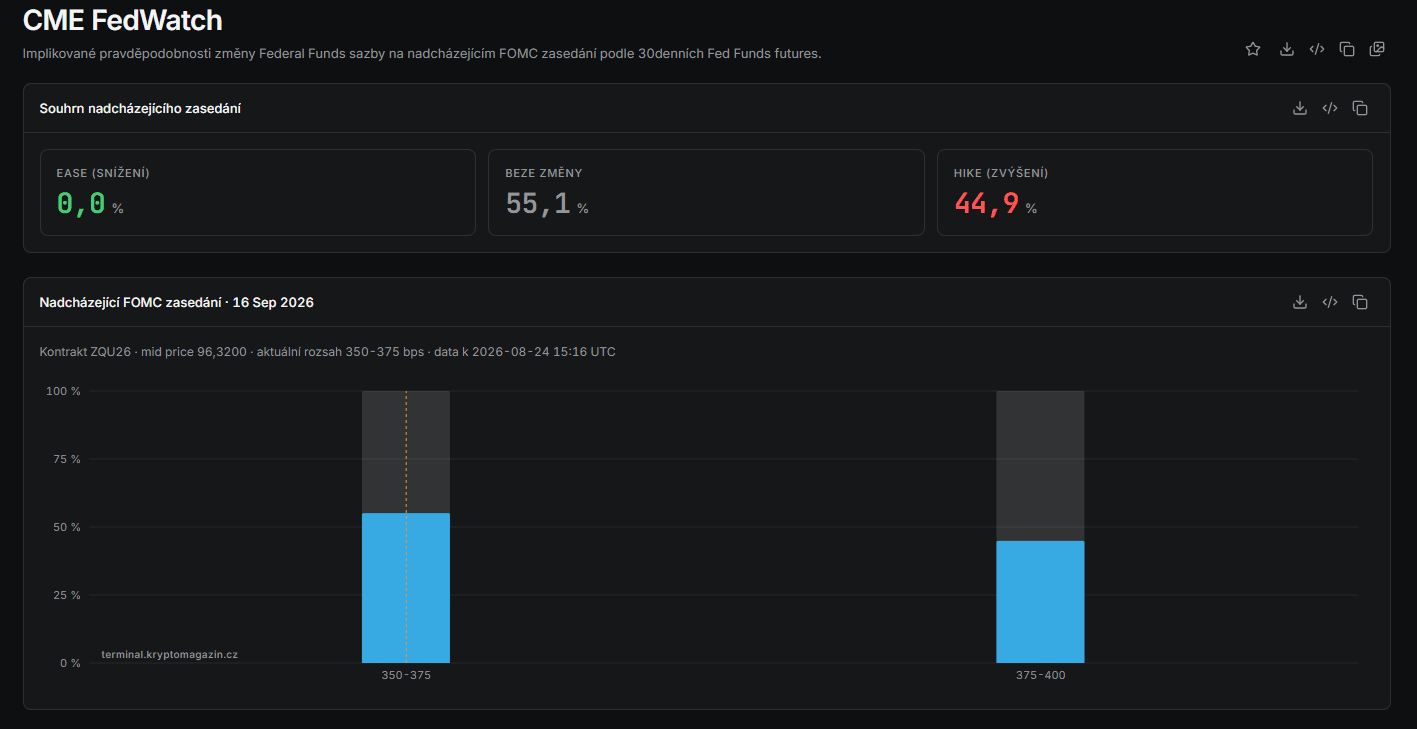
The development of interest rates is absolutely crucial for Bitcoin. Cryptocurrencies belong to the category of risk assets, and their valuation is extremely sensitive to the availability of global liquidity and the cost of capital. Recall that in July, the Fed left rates in the 3.50–3.75% range, with three committee members voting for a further increase at that time.
US Yields Remain High
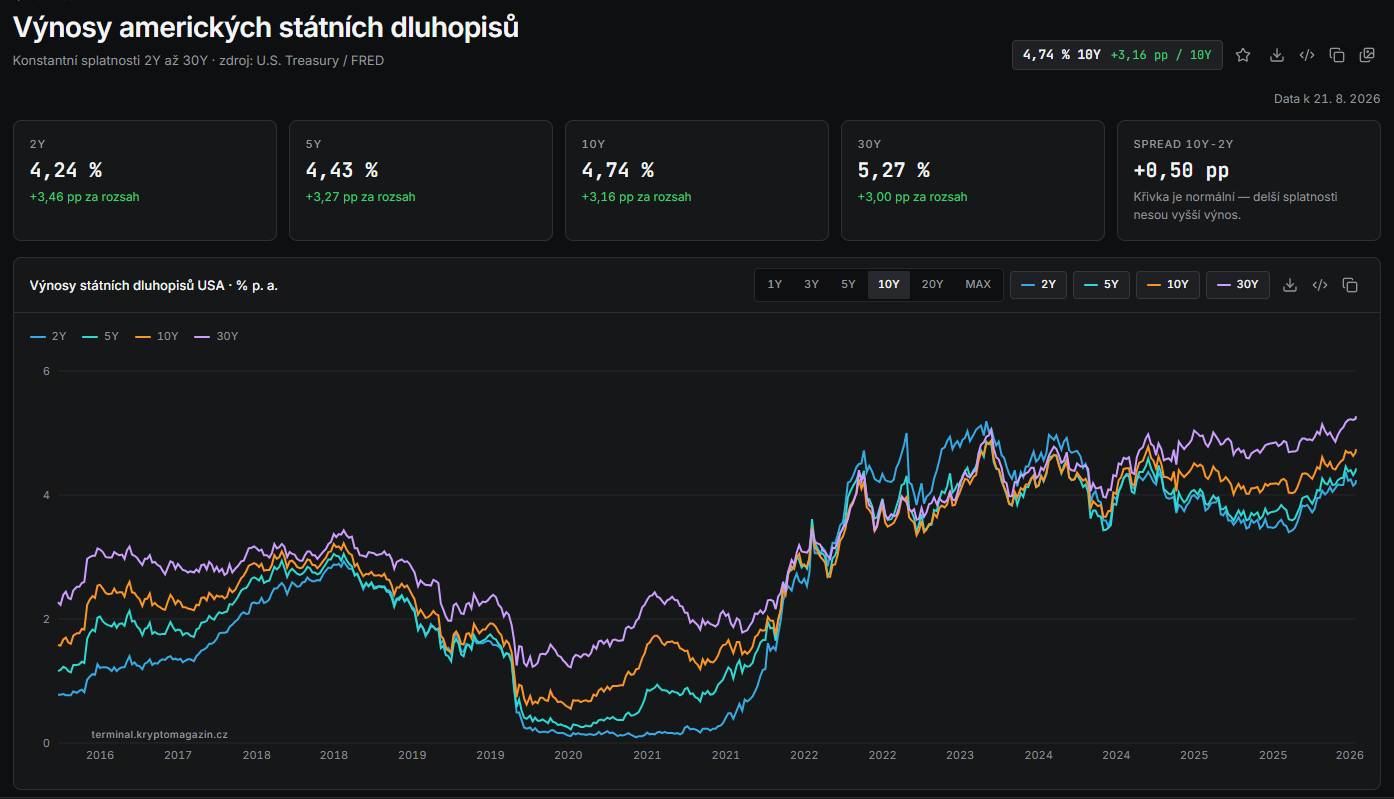
Tension also persists in the US Treasury market. The yield on the closely watched 10-year bond is hovering around 4.74%, while the 30-year bond has surpassed the 5.25% mark. High yields on safe bonds naturally increase their attractiveness at the expense of riskier assets like Bitcoin.
Fed officials will thus have to carefully balance their statements between efforts to curb inflation, support the economy, and the growing pressure to finance the massive US debt. According to the CME FedWatch tool, markets currently assign a 55.1% probability to the scenario that interest rates will remain unchanged even after the September meeting.
PCE Inflation Could Change the Mood
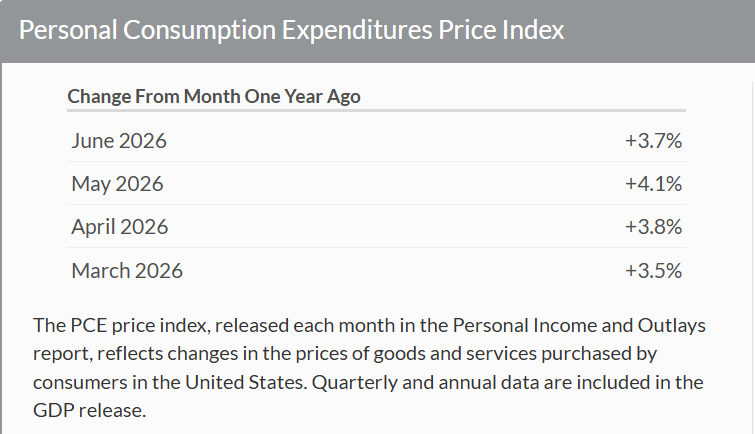
Even before the central bankers' speeches, another important data point awaits the markets. On Wednesday, fresh data on the PCE price index, which the Fed considers its preferred inflation indicator, will be released in the US. A slight month-on-month increase of 0.1% and a slowdown in year-on-year inflation from 3.7% to 3.6% are expected.
If inflation were lower than expected, it could bolster hopes for a looser monetary policy, which would be unequivocally positive news for Bitcoin.
US Treasury and the Debate on Yield Curve Control
Bitcoin's sharp rise last week was not driven solely by technical analysis. A significant impulse was the US Treasury's decision to sharply increase the volume of Treasury buybacks to at least $4 billion per auction.
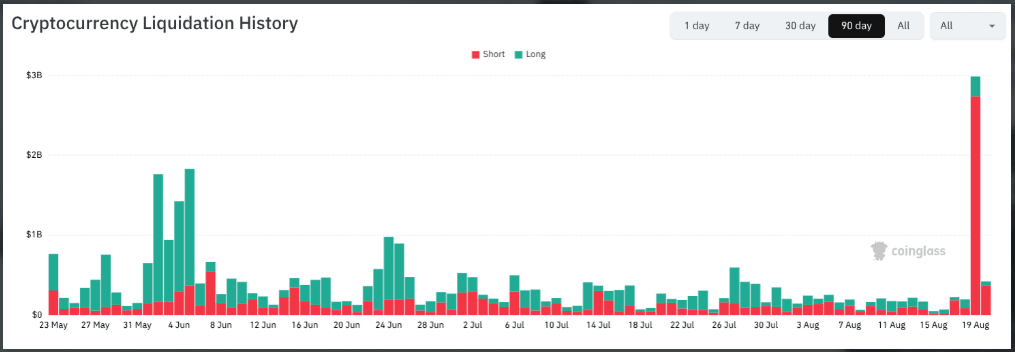
The market reacted exceptionally strongly—within 48 hours, short positions (bets on a decline) were liquidated in a record volume of approximately $3.1 billion. This "short squeeze" drove the price steeply upward as traders were forced to close their losing positions.
This situation opened a debate about so-called YCC (Yield Curve Control). This is a mechanism where the state actively intervenes in the bond market to prevent an undesirable rise in their yields. If the US were to adopt this regime on a larger scale, it would have a breakthrough impact on both the US dollar and Bitcoin.
Institutional Interest: ETFs Report Billion-Dollar Increases
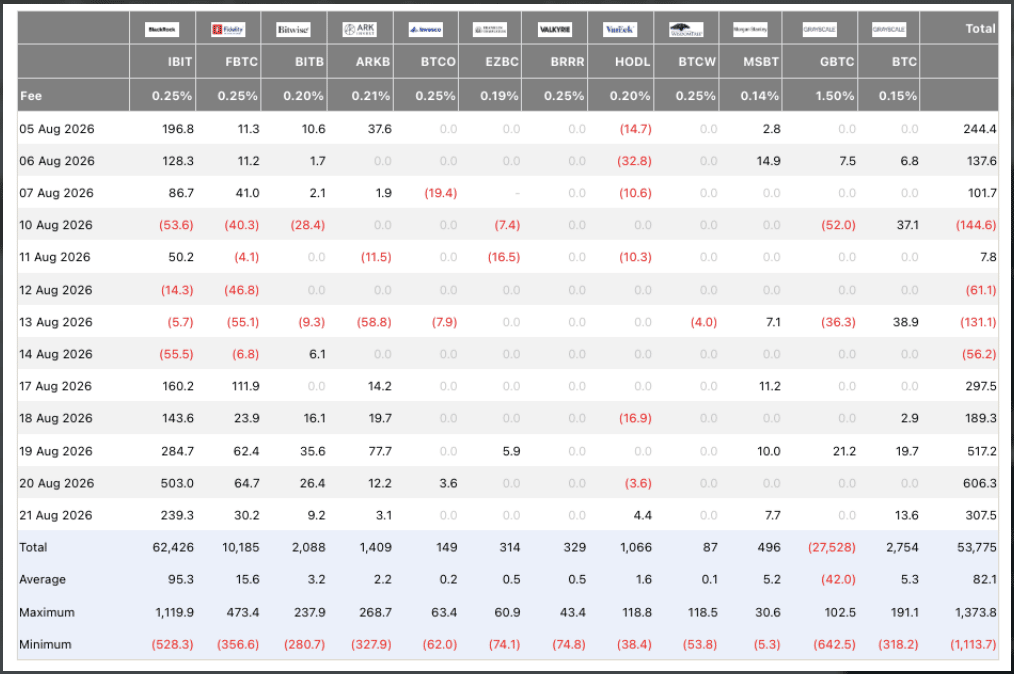
Positive signals are also coming directly from the cryptocurrency market. US spot Bitcoin ETFs recorded a massive net capital inflow of approximately $1.9 billion in the past week. BlackRock's IBIT fund alone saw an inflow exceeding half a billion dollars in a single day on Thursday.
This institutional demand is perhaps more important than the price chart itself. If billions of dollars are flowing into the market through regulated investment products, the current rally stands on much firmer foundations than in the past.
August as a Month of Reversal
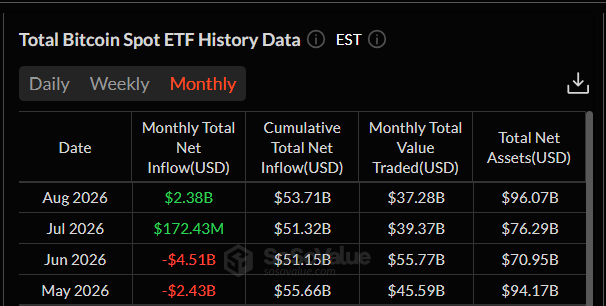
The current situation represents a sharp contrast to previous months. In June, US spot Bitcoin ETFs recorded a record capital outflow exceeding $4.5 billion. By the end of last week, however, the total August inflow reached $2.38 billion.
Market sentiment can turn in a flash. While just a few weeks ago investors were withdrawing money in a panic, now big capital is returning on an even larger scale.
Conclusion: Bitcoin at a Crossroads
Bitcoin is at a promising point. The price has crossed the 50-week EMA, most holders are back in profit, and institutional money is pouring into the market. However, the upcoming macroeconomic data and speeches in Jackson Hole will be decisive.
It is now key to monitor the $68,000 to $73,000 zone. If Bitcoin maintains this area and overcomes the psychological barrier of $80,000, the market structure will look much healthier. The following hours and days will show whether Bitcoin can defend these higher values in the long term.
Frequently Asked Questions
What technical indicator did Bitcoin surpass last week?▼
Why is the $68,000 to $73,000 zone important?▼
How did Bitcoin ETFs affect the market?▼

Kryptoměnám se věnuji od konce roku 2017. V letech 2018 až 2022 jsem působil jako redaktor Kryptomagazinu a ke psaní jsem se vrátil na konci roku 2025. Zajímám se především o Bitcoin, altcoiny a dění na kryptoměnových trzích, ale sleduji také akcie, dluhopisy, zlato a stříbro. V Kryptomagazinu se věnuji novinkám ze světa kryptoměn a svými články přispívám také do časopisů KryptoHodler a KryptoGuru.