



Bitcoin has endured an extraordinary week marked by the Federal Reserve’s interest rate decision, inflation data, major technology earnings and the largest cryptocurrency hack in history. The $6.3 billion Binance breach pushed BTC down to $76,195, leaving investors wondering whether the market has found a bottom. With US midterm elections approaching, let’s examine the key support and resistance levels that could determine Bitcoin’s next move.
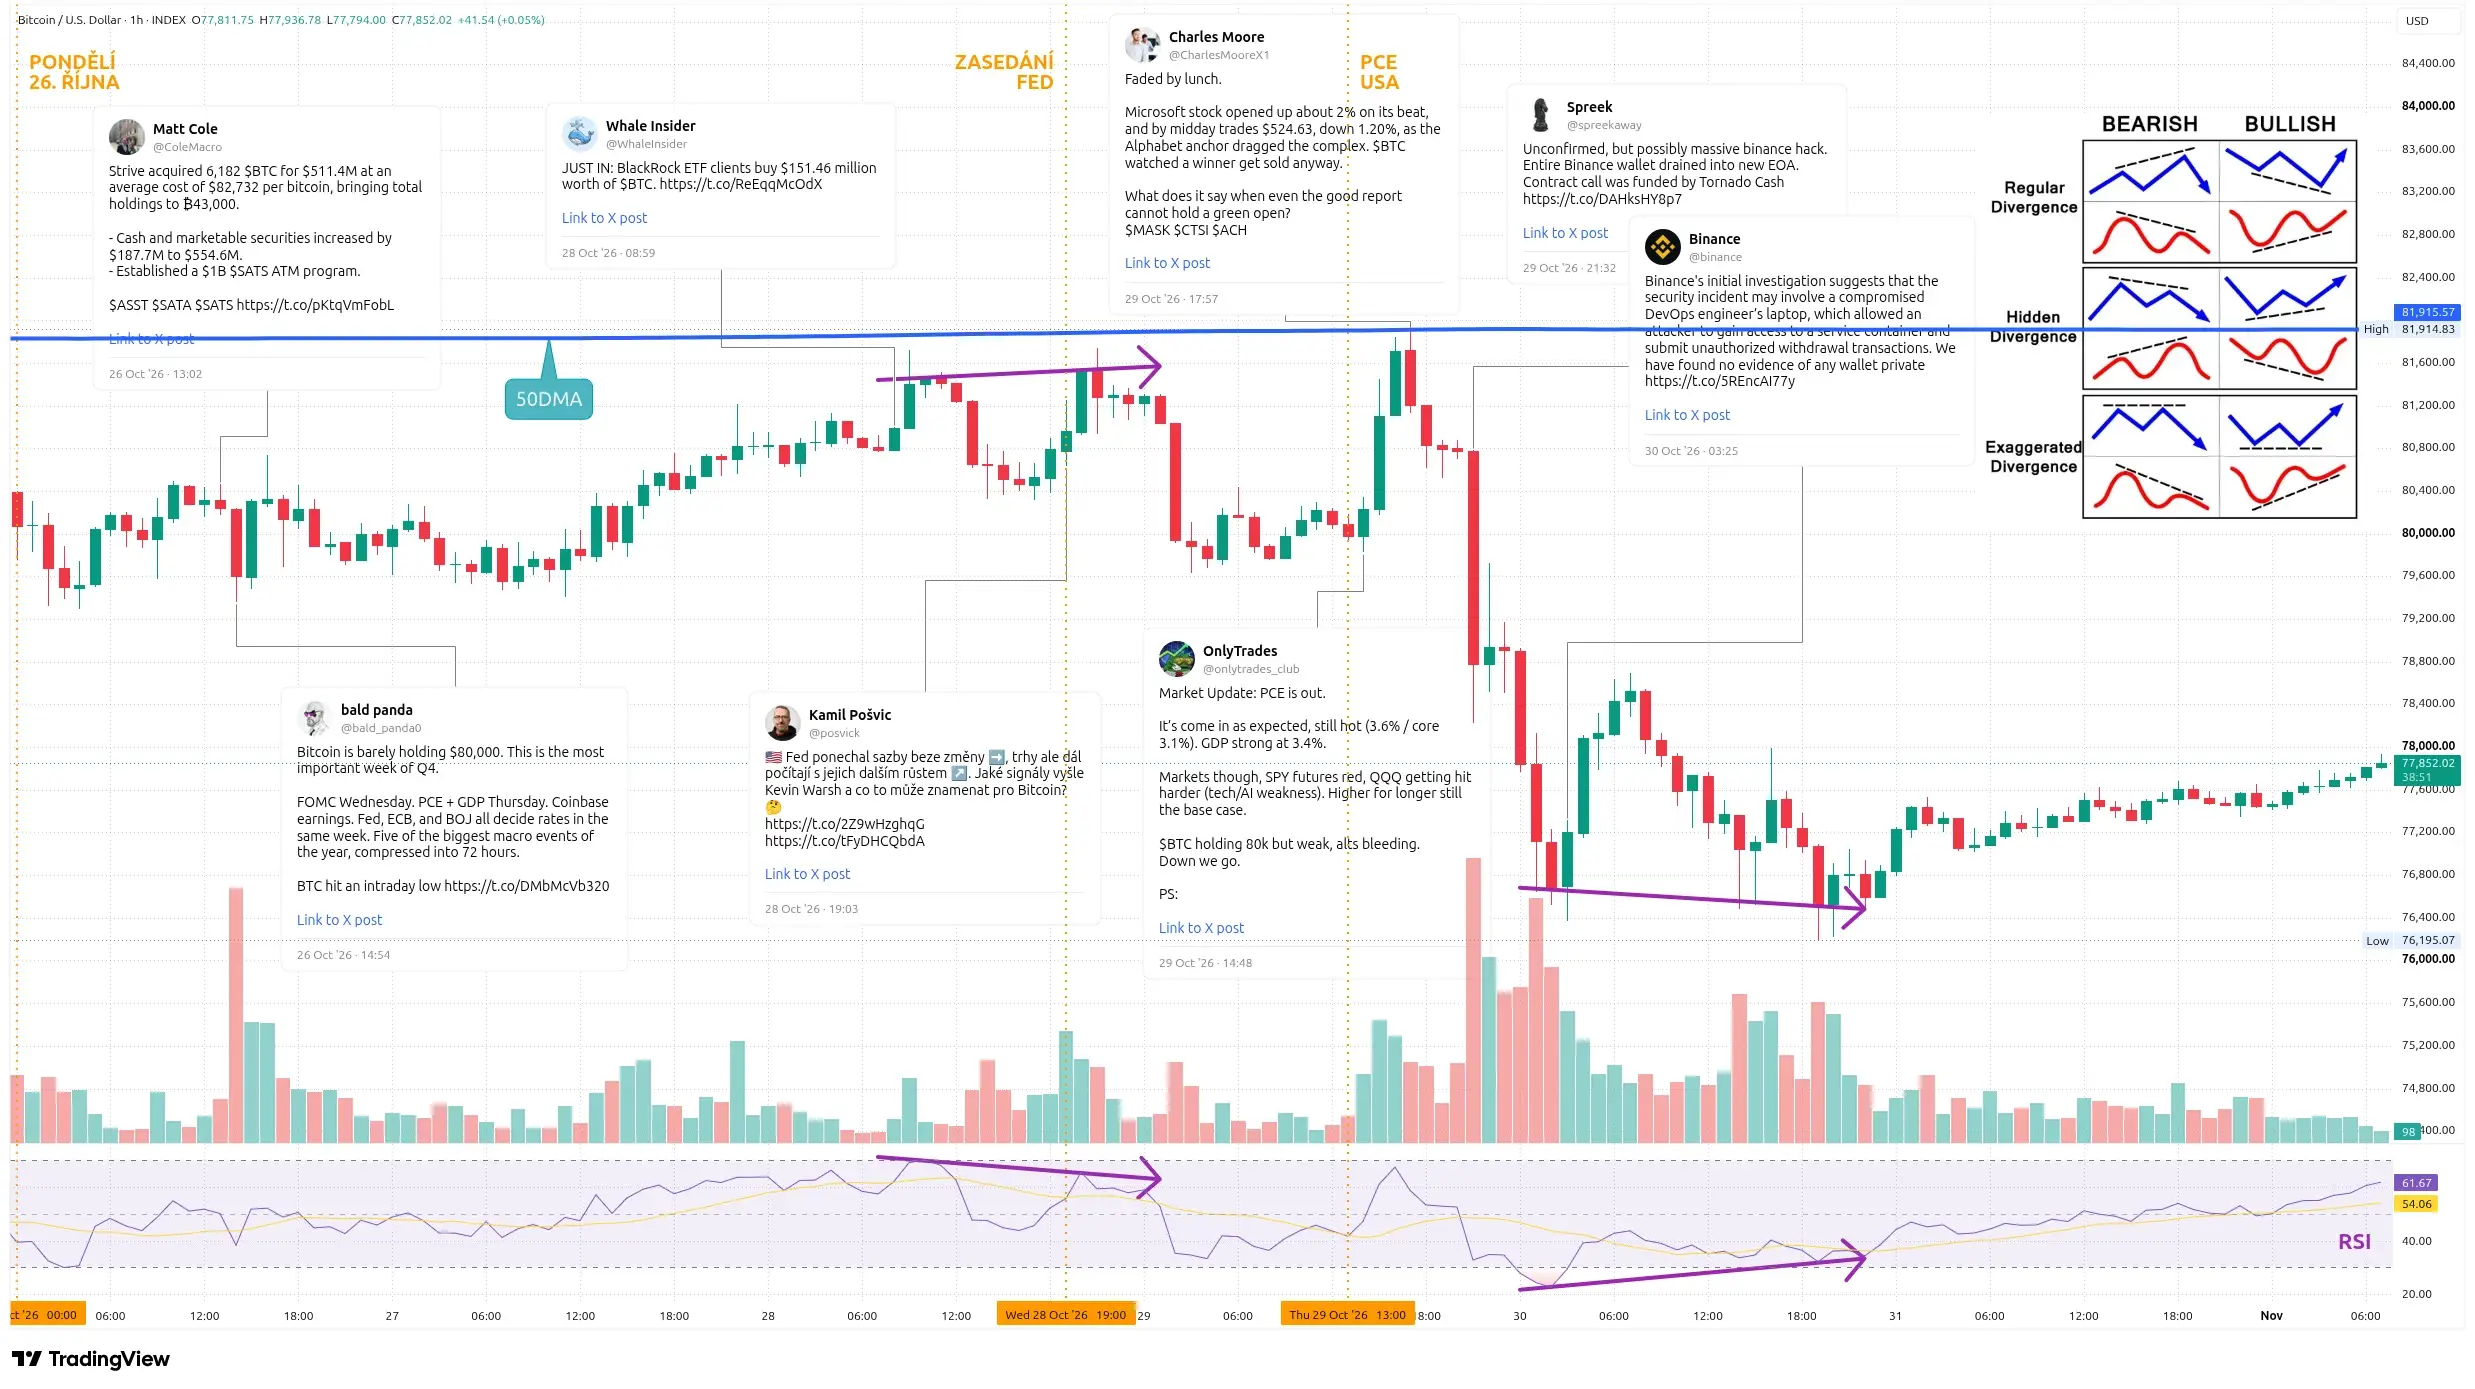
Last Sunday, I questioned whether the 50-day moving average (50DMA) had become resistance. The market provided a clear answer. Bitcoin climbed to a weekly high of $81,915 on Thursday, precisely where the 50DMA was located, before suffering a sharp reversal.
The bearish scenario targeting approximately $75,600 almost materialized. My bullish expectations, however, proved wrong. The $81,800 breakout level was briefly tested, but buyers failed to maintain momentum.
By Sunday morning, Bitcoin was trading around $77,800.
Bitcoin ETFs Started Strong, but BlackRock Dominated Inflows
Bitcoin entered the week near $80,500 before slipping below $80,000 on Monday.
Strategy reported no additional Bitcoin purchases, leaving its holdings unchanged at 848,517 BTC. Instead, the company spent $204.9 million repurchasing preferred shares. Its average Bitcoin acquisition price remains $75,446, an important level to remember.
Meanwhile, Strive announced the purchase of 6,182 BTC for $511.4 million, bringing its total holdings to 43,000 BTC.
US spot Bitcoin ETFs initially showed encouraging demand. Monday brought $110.3 million in net inflows, almost entirely driven by BlackRock’s IBIT. Another $176 million arrived Tuesday, including $151.5 million into IBIT.
Between Monday and Thursday, total inflows reached $440.7 million.
Bitcoin climbed above $81,000 on Tuesday and approached $81,700 on Wednesday. However, a bearish RSI divergence developed on the hourly chart as prices formed higher highs while momentum weakened.
The market was waiting for the Fed.
Fed Leaves Rates Unchanged as Inflation Remains Persistent
On Wednesday, the Federal Reserve kept interest rates unchanged, but the 10–2 vote surprised investors.
Governor Lisa Cook and Cleveland Fed President Beth Hammack favored a 25-basis-point increase. According to Bitcoin Magazine, such joint opposition from a governor and regional Fed president had not occurred since 1992.
Fed Chair Kevin Warsh maintained that monetary policy was beginning to work but refused to rule out a December rate increase.
Thursday’s economic releases strengthened the case for further tightening.
Annual PCE inflation accelerated from 3.4% to 3.6%, while core PCE rose from 3.0% to 3.1%. Meanwhile, third-quarter GDP expanded by 3.4%, beating expectations of approximately 3.0%.
Despite these figures, Bitcoin briefly rallied to $81,915 before encountering resistance at the 50DMA.
Technology stocks offered little support. Microsoft initially gained after its earnings release but quickly reversed. Alphabet and concerns about the profitability of AI investments weighed on the broader sector.
Then came the Binance shock.
The Largest Cryptocurrency Hack in History
Late Thursday, reports emerged of substantial unauthorized withdrawals from Binance wallets.
Bitcoin plunged more than $2,000 within two hours and fell toward $77,000 shortly after midnight.
Binance subsequently confirmed a security incident. Preliminary findings suggested attackers had compromised an engineer’s laptop and initiated unauthorized withdrawals.
Approximately $6.3 billion was stolen across ten blockchains in just 20 minutes, making the incident the largest cryptocurrency theft ever recorded in USD terms.
The previous record belonged to the February 2025 Bybit hack, which resulted in losses of approximately $1.5 billion.
Evidence pointed toward the North Korean-linked TraderTraitor group. Binance suspended withdrawals, while approximately $3 billion in stolen assets were quickly frozen. The exchange pledged to cover customer losses.
The market reaction was severe.
More than $1.5 billion in leveraged cryptocurrency positions were liquidated within 24 hours. Bitcoin’s hourly RSI dropped below 25, signaling deeply oversold conditions.
Although BTC recovered toward $78,600 on Friday morning, another sell-off pushed the price to a weekly low of $76,195.
Interestingly, the RSI formed a higher low while the price established a lower low, creating a potential bullish divergence.
ETF investors also responded aggressively. Friday saw $643.3 million in net outflows, the largest daily withdrawal since June 25. BlackRock’s IBIT lost $233.7 million, Fidelity’s FBTC $201 million and ARKB $129.6 million.
Nevertheless, total weekly ETF outflows amounted to only slightly more than $200 million.
Four-Hour Chart Reveals a Bearish Market Structure
Last week’s analysis focused on a descending triangle with support around $80,750.
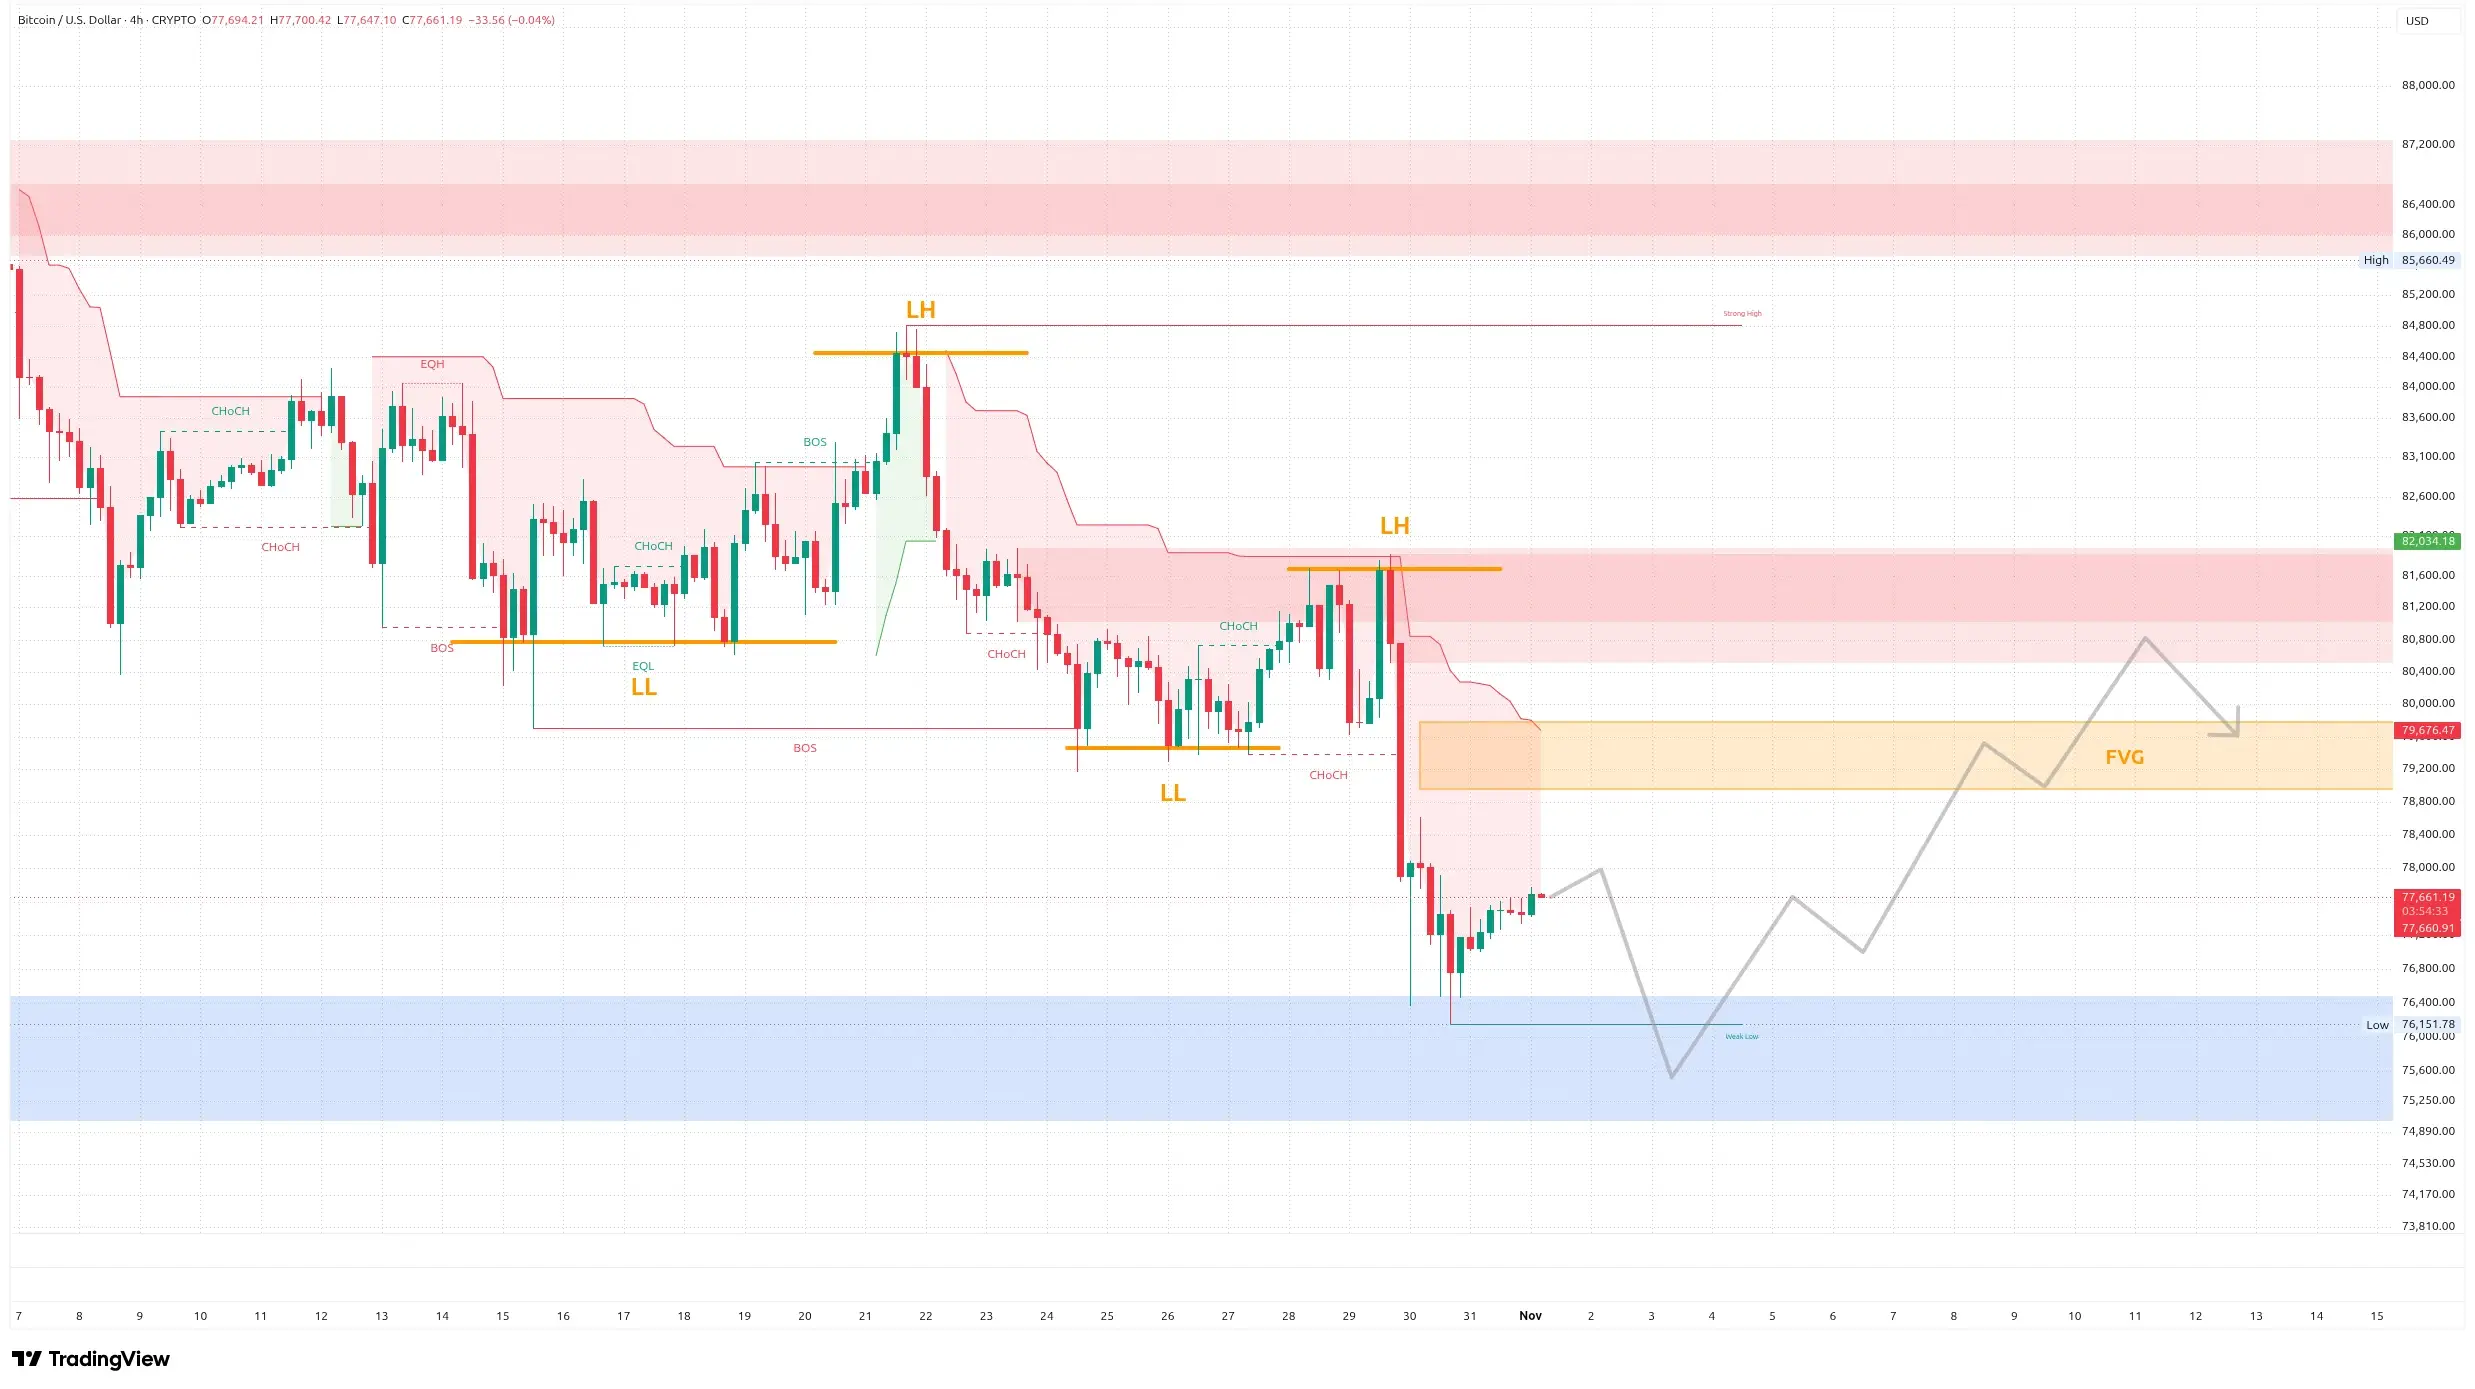
Bitcoin briefly reclaimed this level between Tuesday and Thursday, but the Binance hack triggered another breakdown. The triangle’s projected target near $75,630 was almost reached.
This week, I applied Smart Money Concepts (SMC) to the four-hour chart.
The structure remains clearly bearish, with lower highs and lower lows developing since October 21.
A substantial supply zone lies between $80,500 and $82,000. Thursday’s sell-off also created an unfilled Fair Value Gap (FVG) between $79,000 and $79,700.
Below the current price, the demand zone extends from approximately $74,900 to $76,500.
My preferred scenario involves an initial liquidity sweep below Friday’s low, potentially around Tuesday’s elections. Bitcoin could subsequently recover to fill the FVG and possibly test the supply zone near $80,800.
Daily Chart Resembles Bitcoin’s Reaction to the 2023 Silvergate Collapse
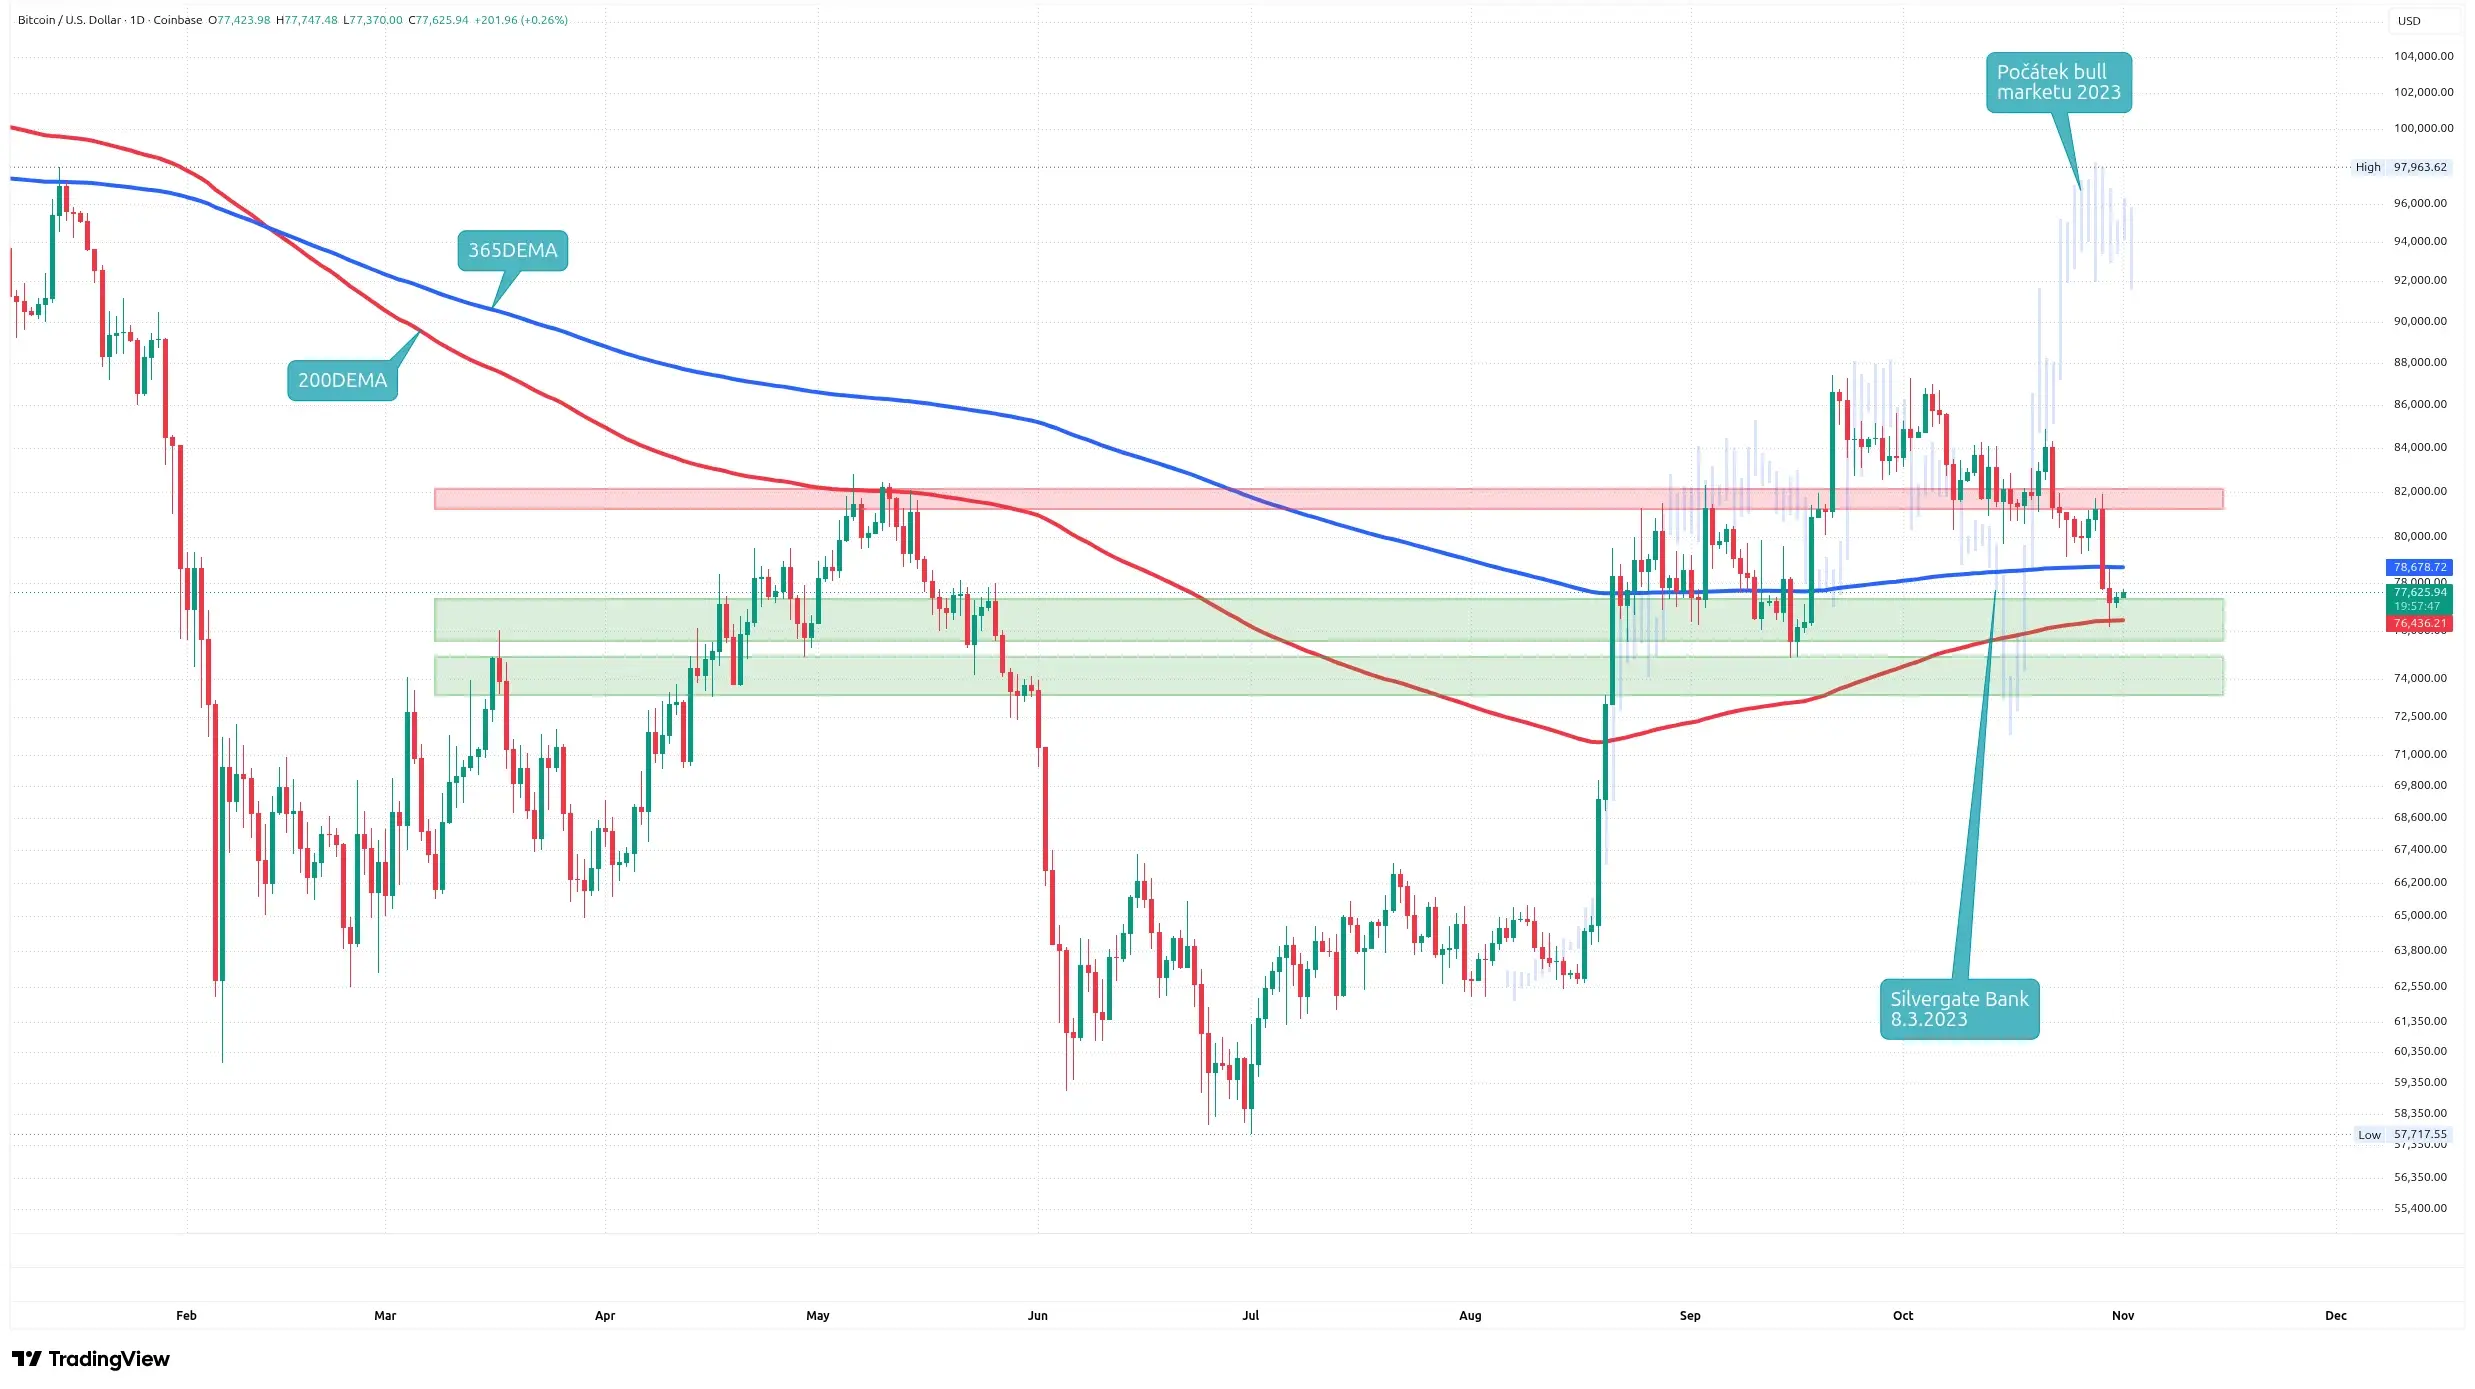
The daily chart confirms that Bitcoin has reached its double-top target near $80,150.
Friday’s decline also brought the price close to the extended target around $75,000, invalidating a previously observed hidden bullish RSI divergence.
Two long-term exponential moving averages now deserve attention.
Bitcoin broke below the 365-day EMA at $78,679, which could become resistance. However, the 200-day EMA near $76,436 provided support on Friday.
The price is currently trading between these two indicators.
An interesting historical parallel comes from March 2023, when the collapse of Silvergate Bank pushed Bitcoin below $20,000. The market recovered within days and subsequently rallied.
The current Binance incident has also caused a sharp decline without directly affecting Bitcoin’s underlying network.
History never repeats perfectly, but reactions to cryptocurrency-specific shocks sometimes follow similar patterns.
Major resistance remains between $81,300 and $82,000. The first support zone extends from $75,900 to $77,400, followed by a deeper range between $73,500 and $75,200.
Weekly Chart Tests the 50-Week Moving Average
The weekly timeframe offers one of the most important technical levels.
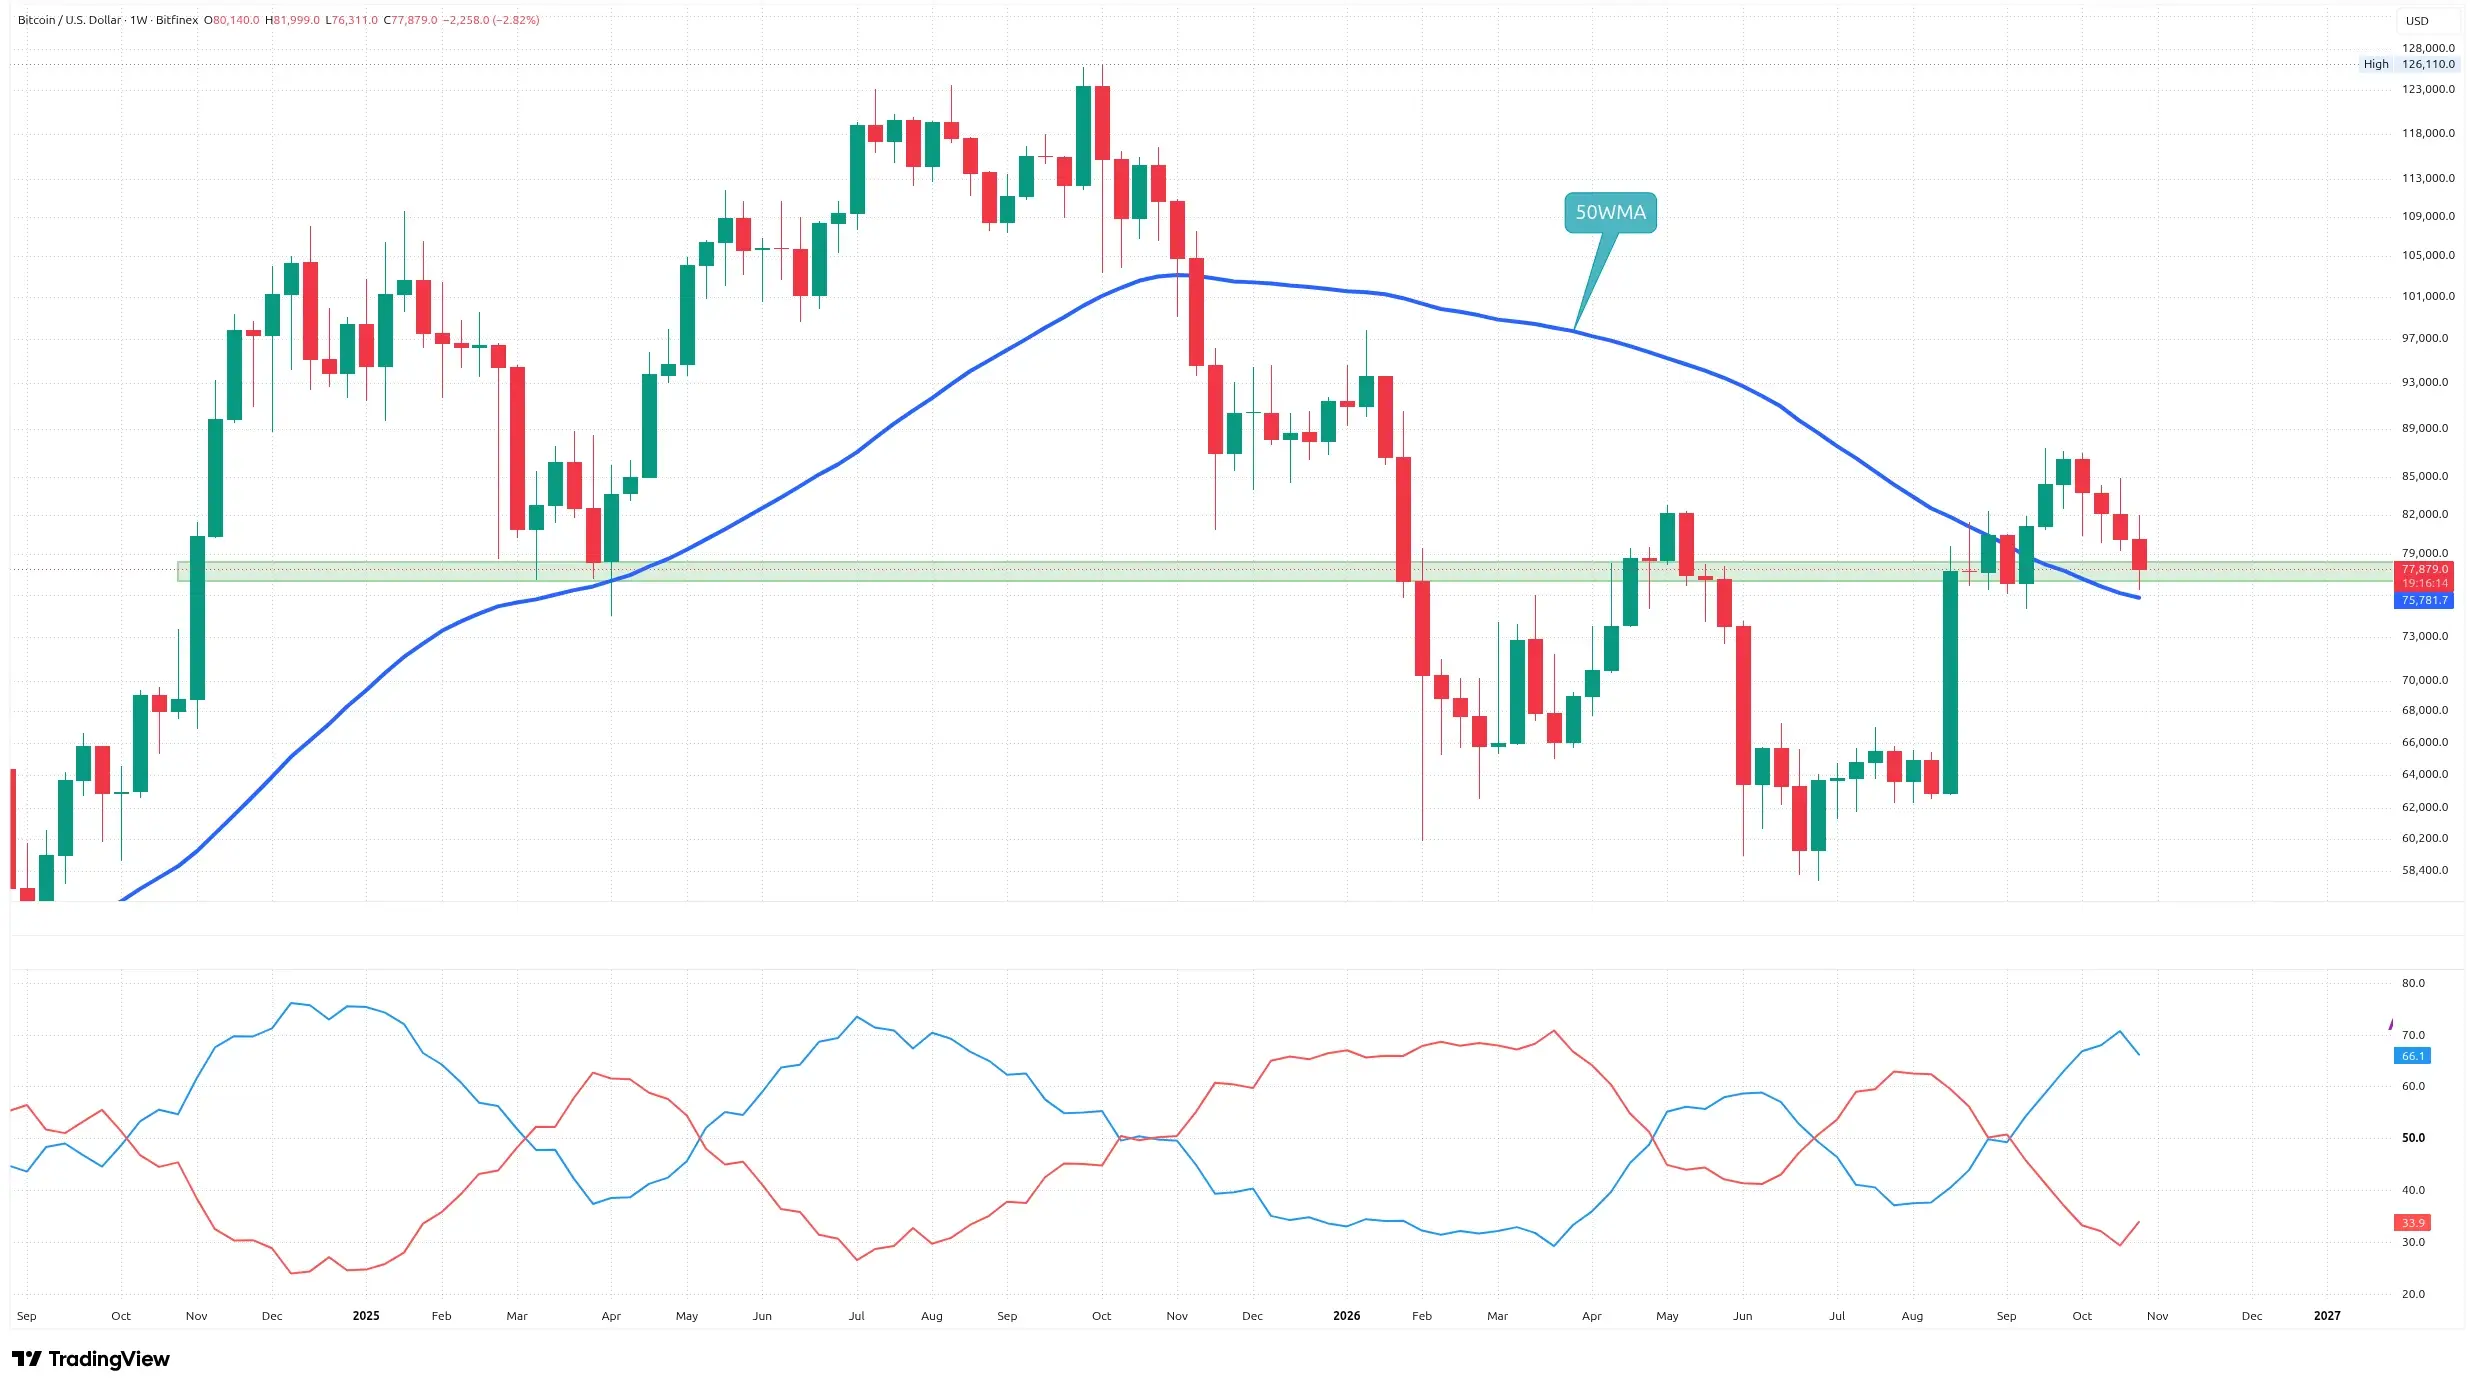
Bitcoin’s 50-week moving average (50WMA) currently stands at approximately $75,782.
This level closely aligns with the cost basis of short-term holders and Strategy’s average Bitcoin purchase price.
Just above it lies a historical support zone between $76,800 and $78,300, which previously supported the market in March and April 2025 and again in September 2026.
The current weekly candlestick has developed a relatively long lower wick, suggesting that buyers are defending lower prices.
I also examined the Average Sentiment Oscillator (ASO), which measures bullish and bearish pressure within candlesticks.
Bulls still dominate with a reading of 66 versus 34 for bears. However, the bullish line has turned downward for the first time this week.
Similar bearish crossovers in November 2025 and June 2026 preceded deeper corrections. We have not reached that point yet.
On-Chain Data Highlights Support Around $75,800
On-chain indicators reinforce the technical importance of the $75,000–$76,000 region.
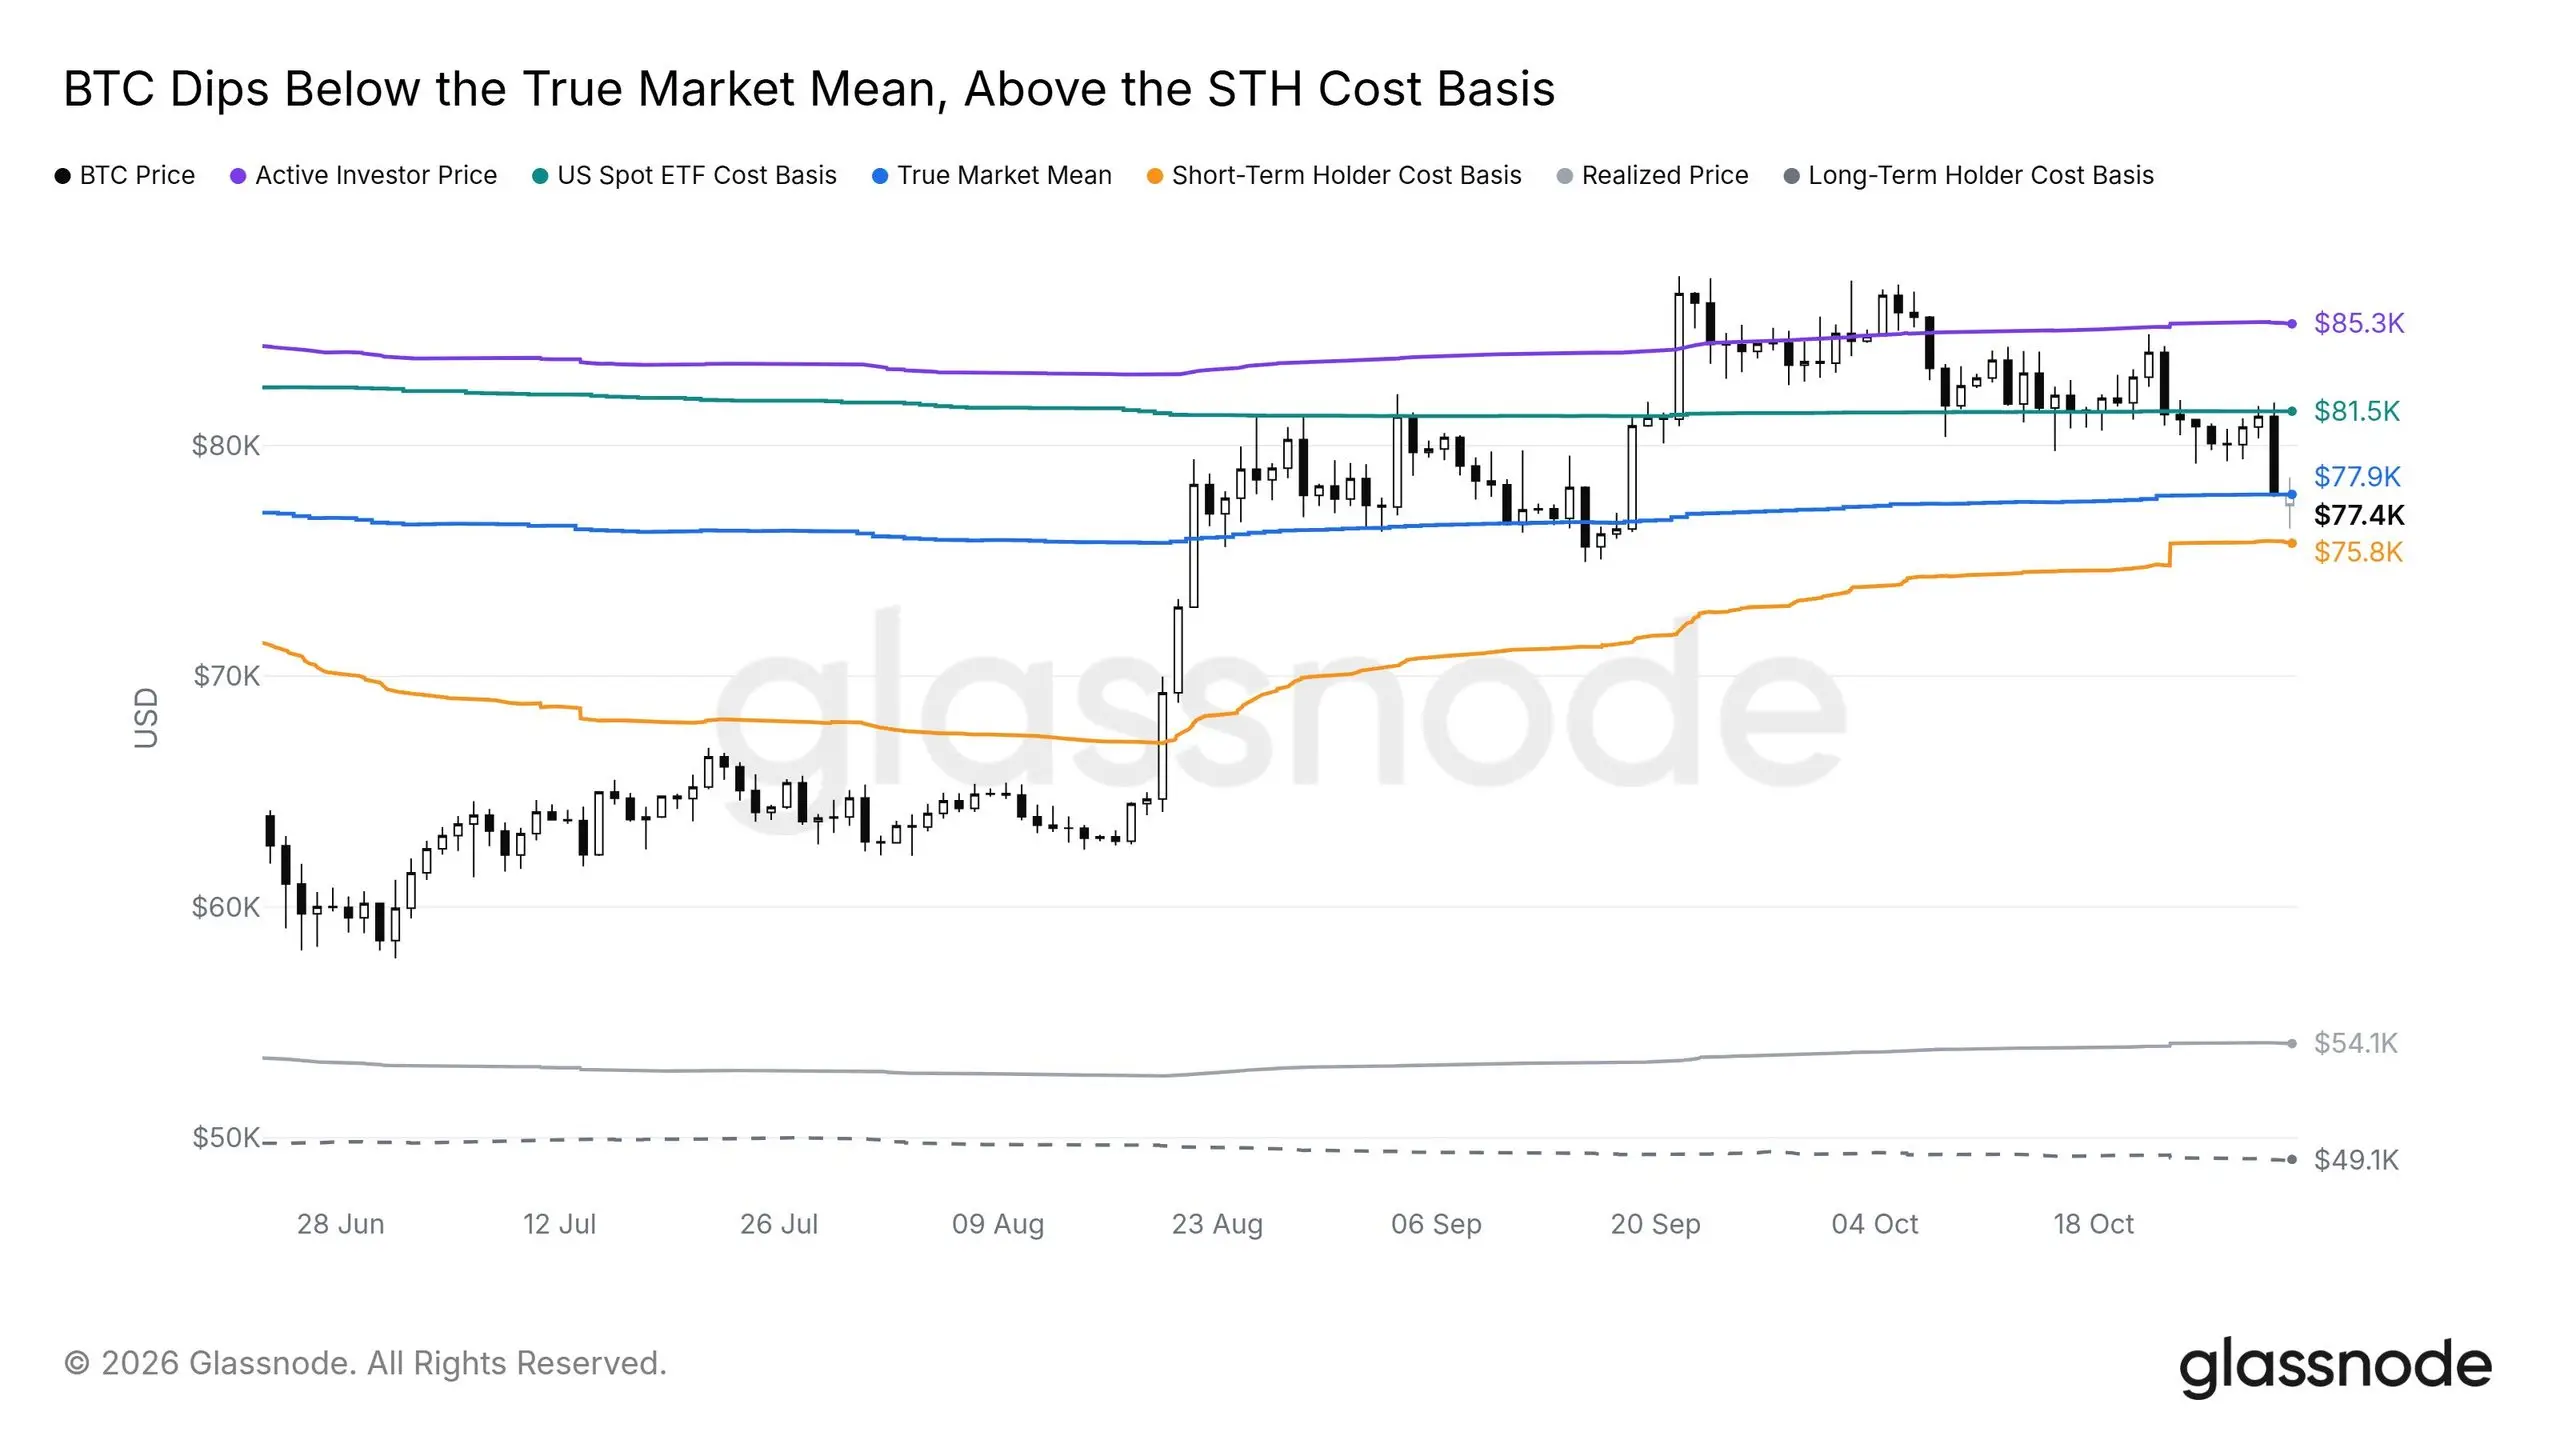
According to Glassnode, Bitcoin briefly fell below the True Market Mean near $77,900, representing the average acquisition price of economically active investors.
However, BTC remains above the short-term holder cost basis of approximately $75,800.
Glassnode considers tests of this level relatively normal during bull markets. A similar retest occurred in mid-September before a substantial rally.
Meanwhile, the average acquisition price of US spot Bitcoin ETFs stands near $81,500 according to Glassnode, although CryptoQuant estimates a considerably lower figure of $72,300.
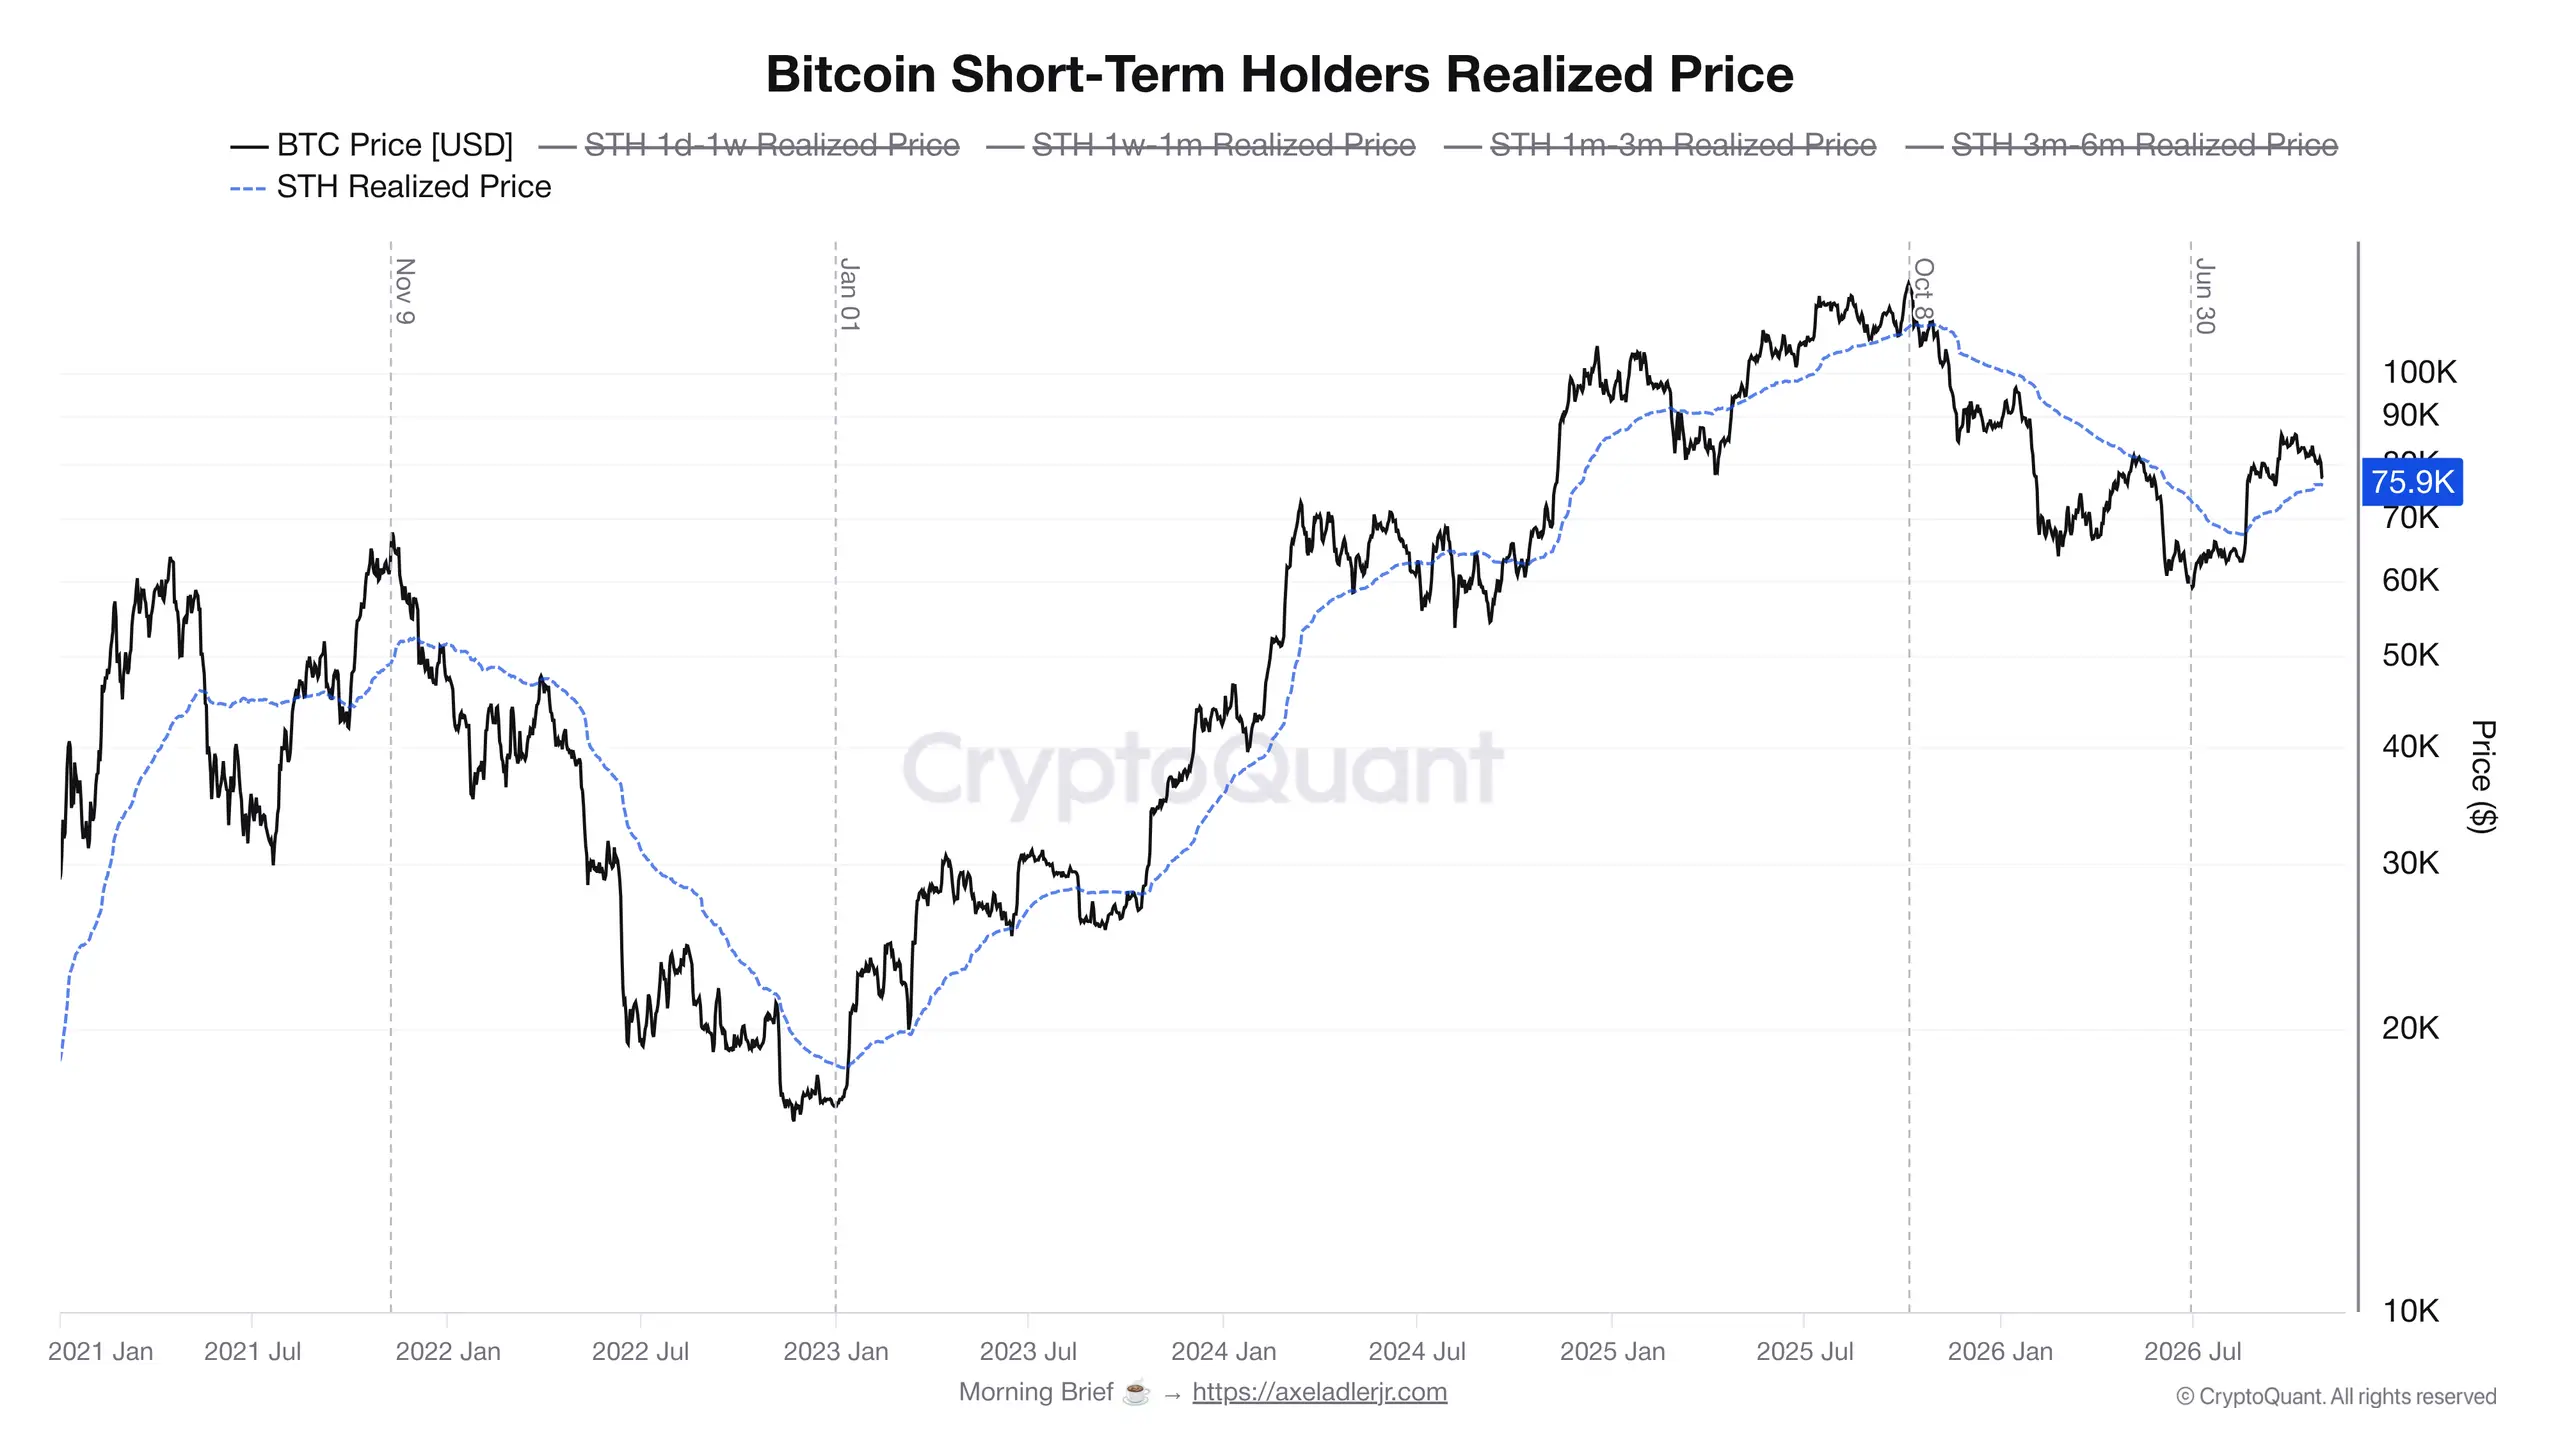
Analyst Axel Adler Jr. places the short-term holder realized price near $75,900.
Historically, this level has served as a dividing line between bullish and bearish market conditions.
Bitcoin losing the level in November 2021 and October 2025 preceded bearish periods. Reclaiming it in early 2023 and August 2026 supported subsequent rallies.
Adler also considers Bitcoin’s reaction to the Binance hack relatively moderate compared with the market collapse following FTX.
I agree with that assessment.
Are Short-Term Bitcoin Holders Capitulating?
Recent on-chain movements suggest some investors are selling under pressure.
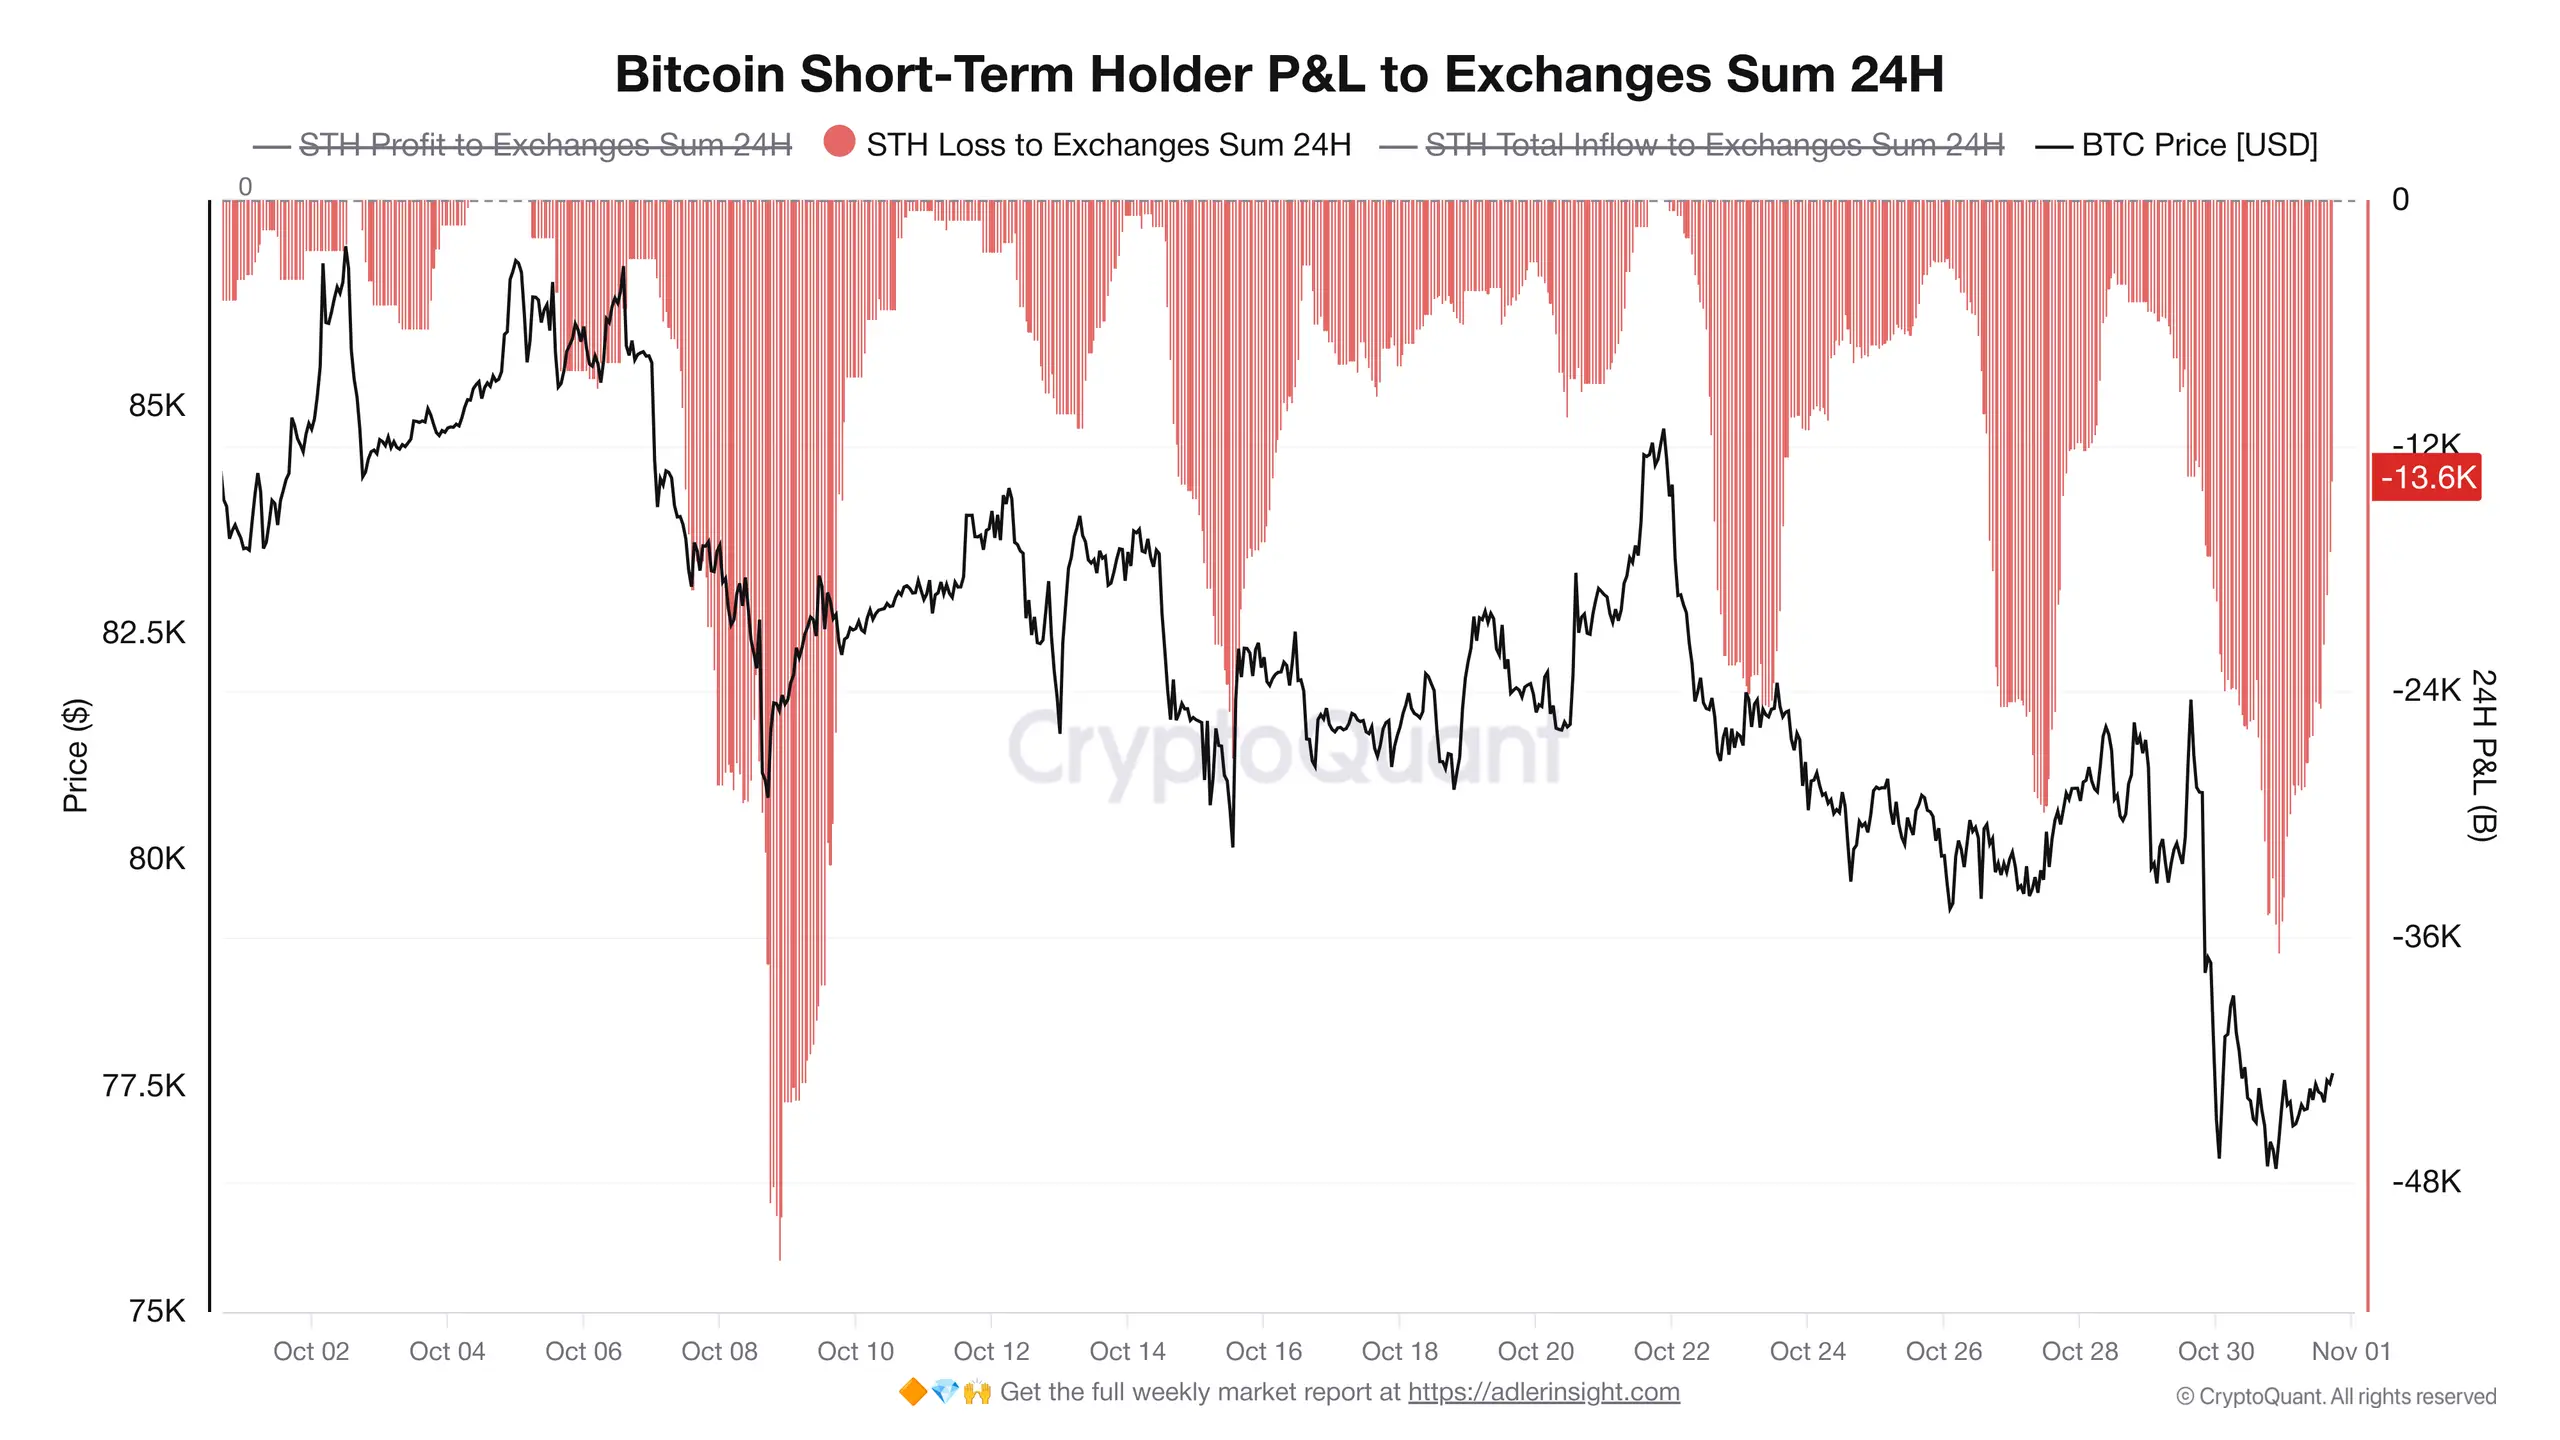
Within 24 hours, short-term holders transferred more than 36,600 BTC to exchanges while holding unrealized losses.
This was the second-highest reading since October, when comparable transfers reached 45,400 BTC.
Such exchange deposits do not necessarily indicate immediate selling, but they significantly increase the probability.
More recently, the volume declined toward 13,600 BTC, suggesting that the most intense selling pressure may have passed.
Alternatively, the slowdown could simply reflect reduced weekend activity.
Market sentiment reflects similar nervousness.
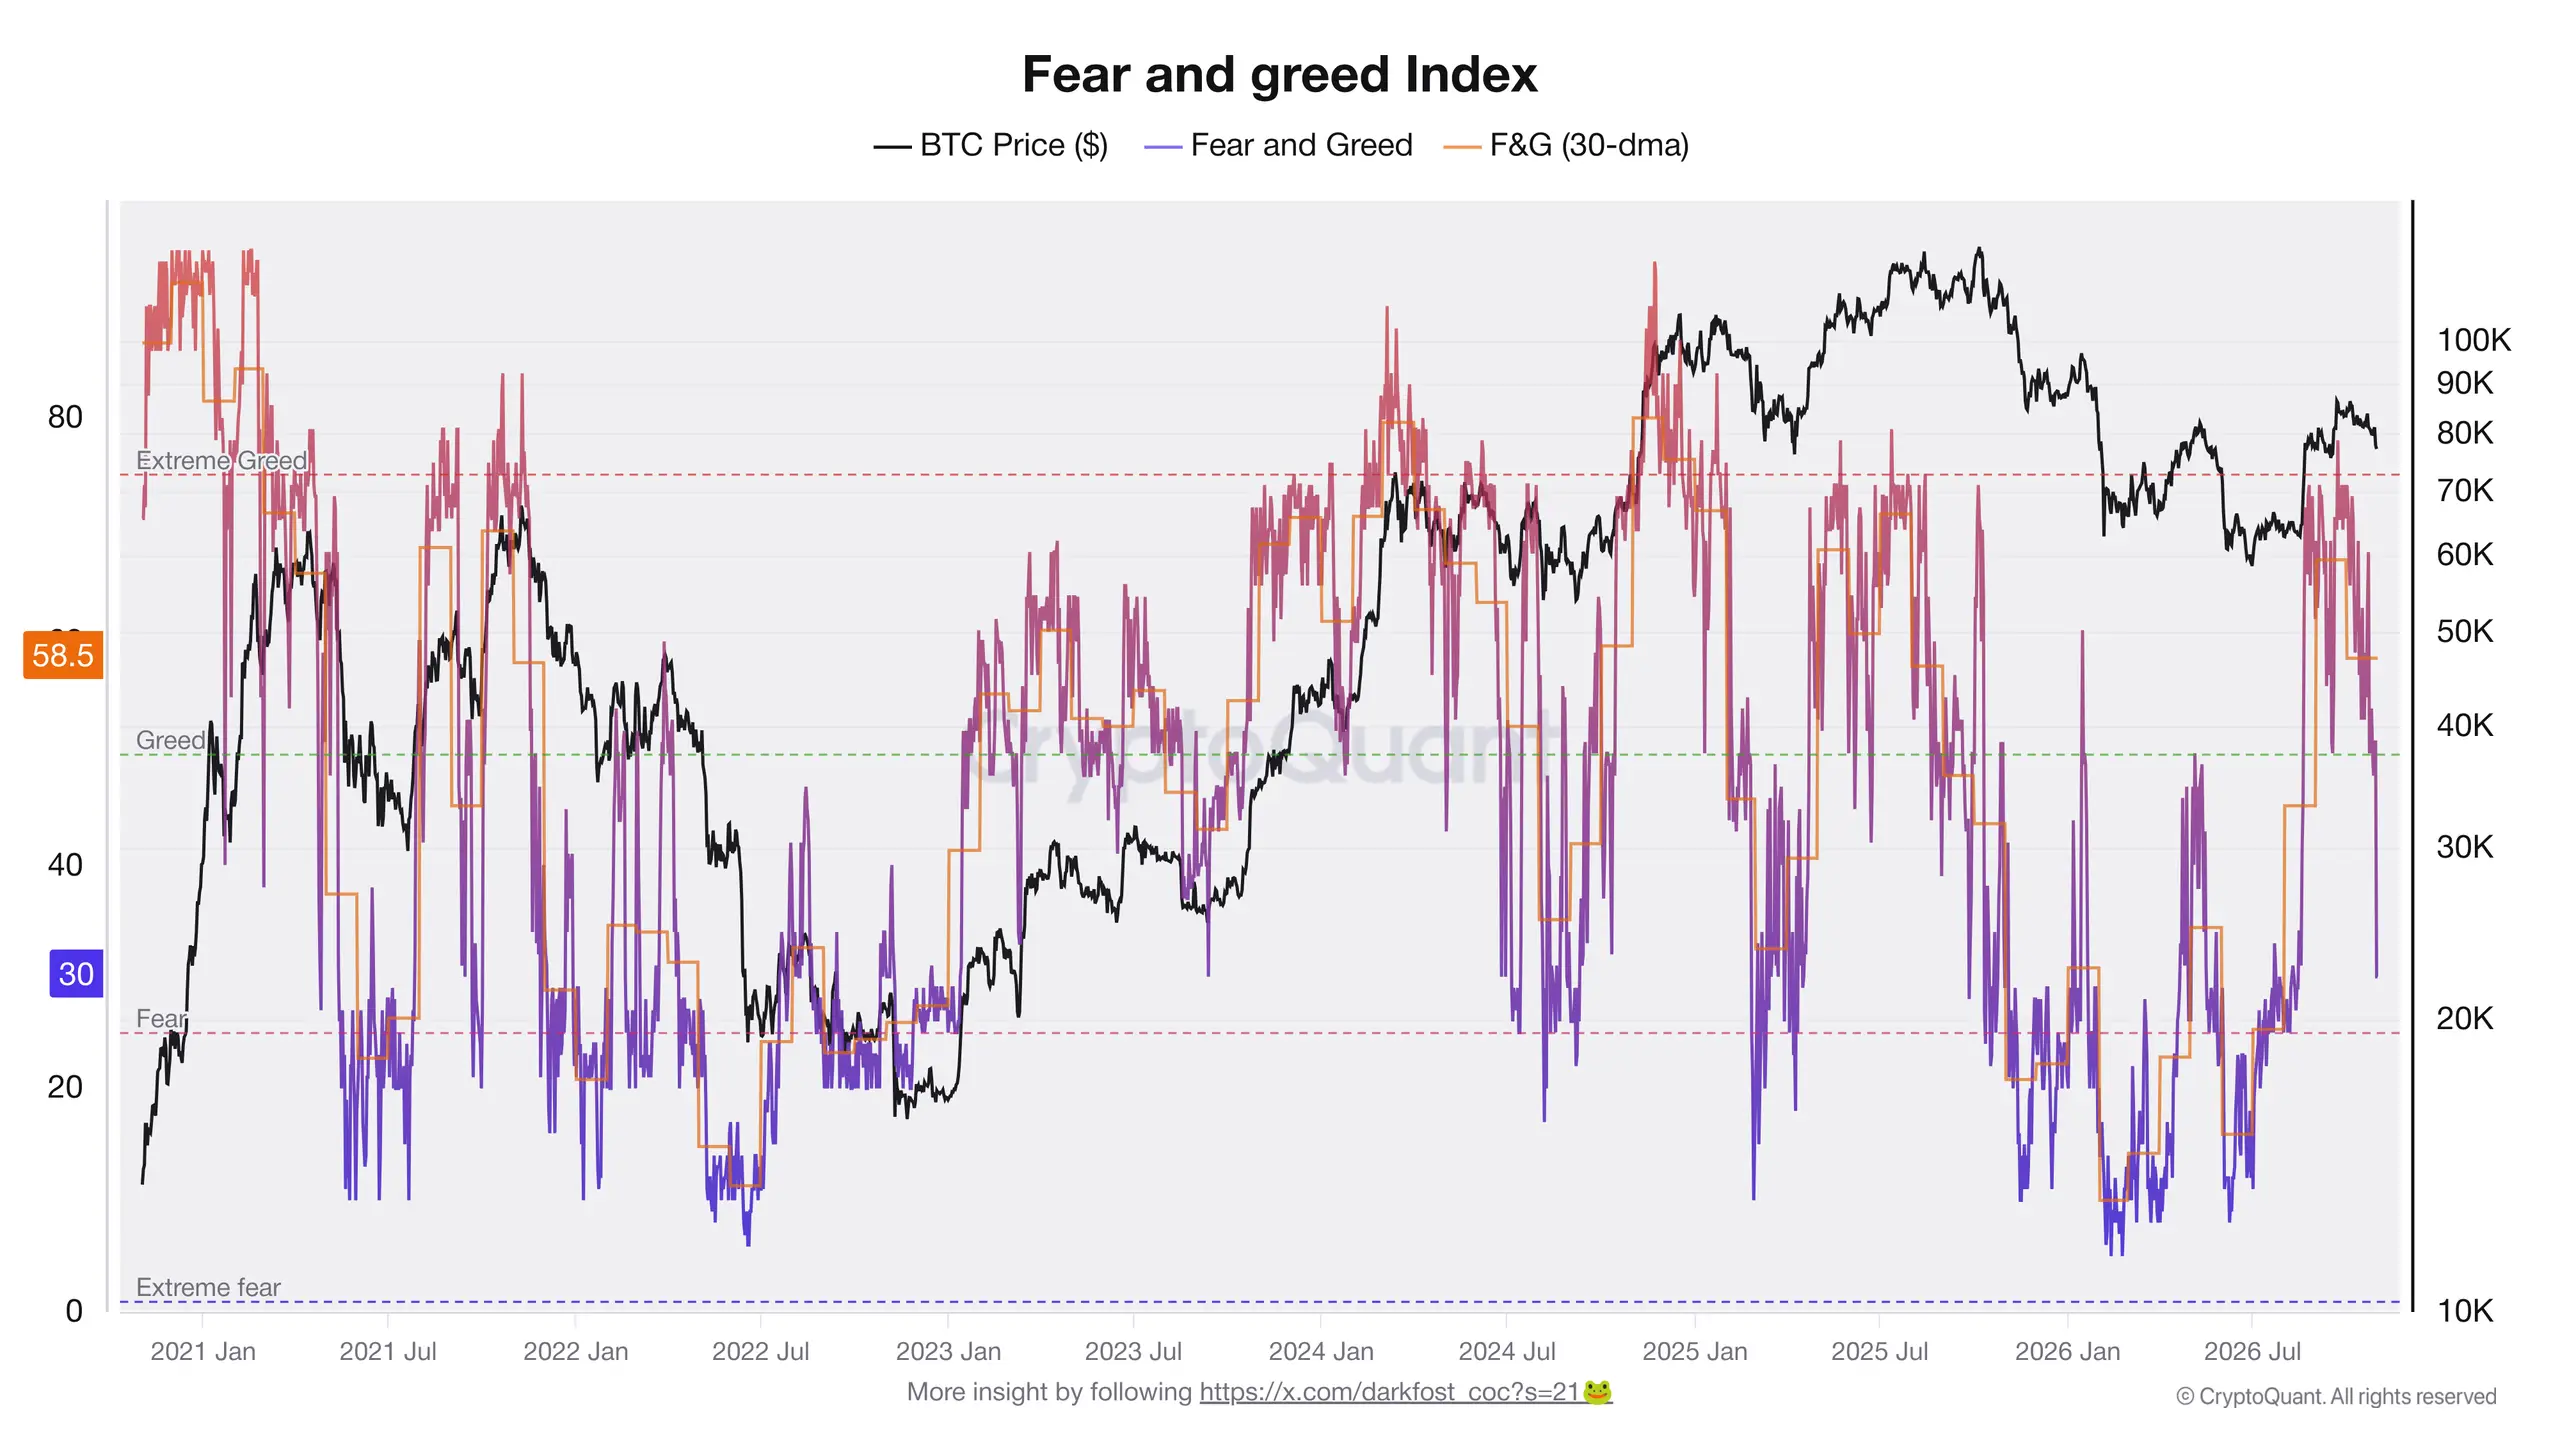
The Crypto Fear & Greed Index dropped from 51 to 30 in just one day, its lowest reading since mid-August.
Historically, periods of elevated fear have sometimes created attractive accumulation opportunities.
However, a reading of 30 indicates fear rather than extreme fear, which generally begins below 25. Sentiment could deteriorate further.
The positive aspect is that the current panic stems primarily from a centralized exchange security incident rather than a deterioration in Bitcoin’s fundamentals.
What Should Investors Watch Next Week?
The main event will be Tuesday’s US midterm elections.
All 435 seats in the House of Representatives and 35 Senate seats are being contested. Polls suggest Republicans could lose control of the House and potentially the Senate.
Such an outcome could complicate President Donald Trump’s legislative agenda.
Historically, however, Wall Street has sometimes welcomed divided government because it can reduce the likelihood of unexpected policy changes.
Technology stocks represent another important risk.
Following disappointing market reactions to earnings from Amazon and Intel, semiconductor stocks suffered heavy losses on Friday. Intel shares declined by 28%.
Investors will watch whether selling pressure continues when US markets reopen on Monday.
Upcoming earnings from Apple, Palantir, AMD and Qualcomm could influence sentiment across technology and cryptocurrency markets.
Oil prices also deserve attention.
Brent crude remains near $112 per barrel amid tensions surrounding the Strait of Hormuz and Iran. Further escalation could increase inflationary pressure and complicate monetary policy decisions.
Friday’s US employment report will provide another important signal.
Economists expect approximately 55,000–65,000 new jobs, compared with 29,000 in September. The unemployment rate is expected to remain at 4.2%.
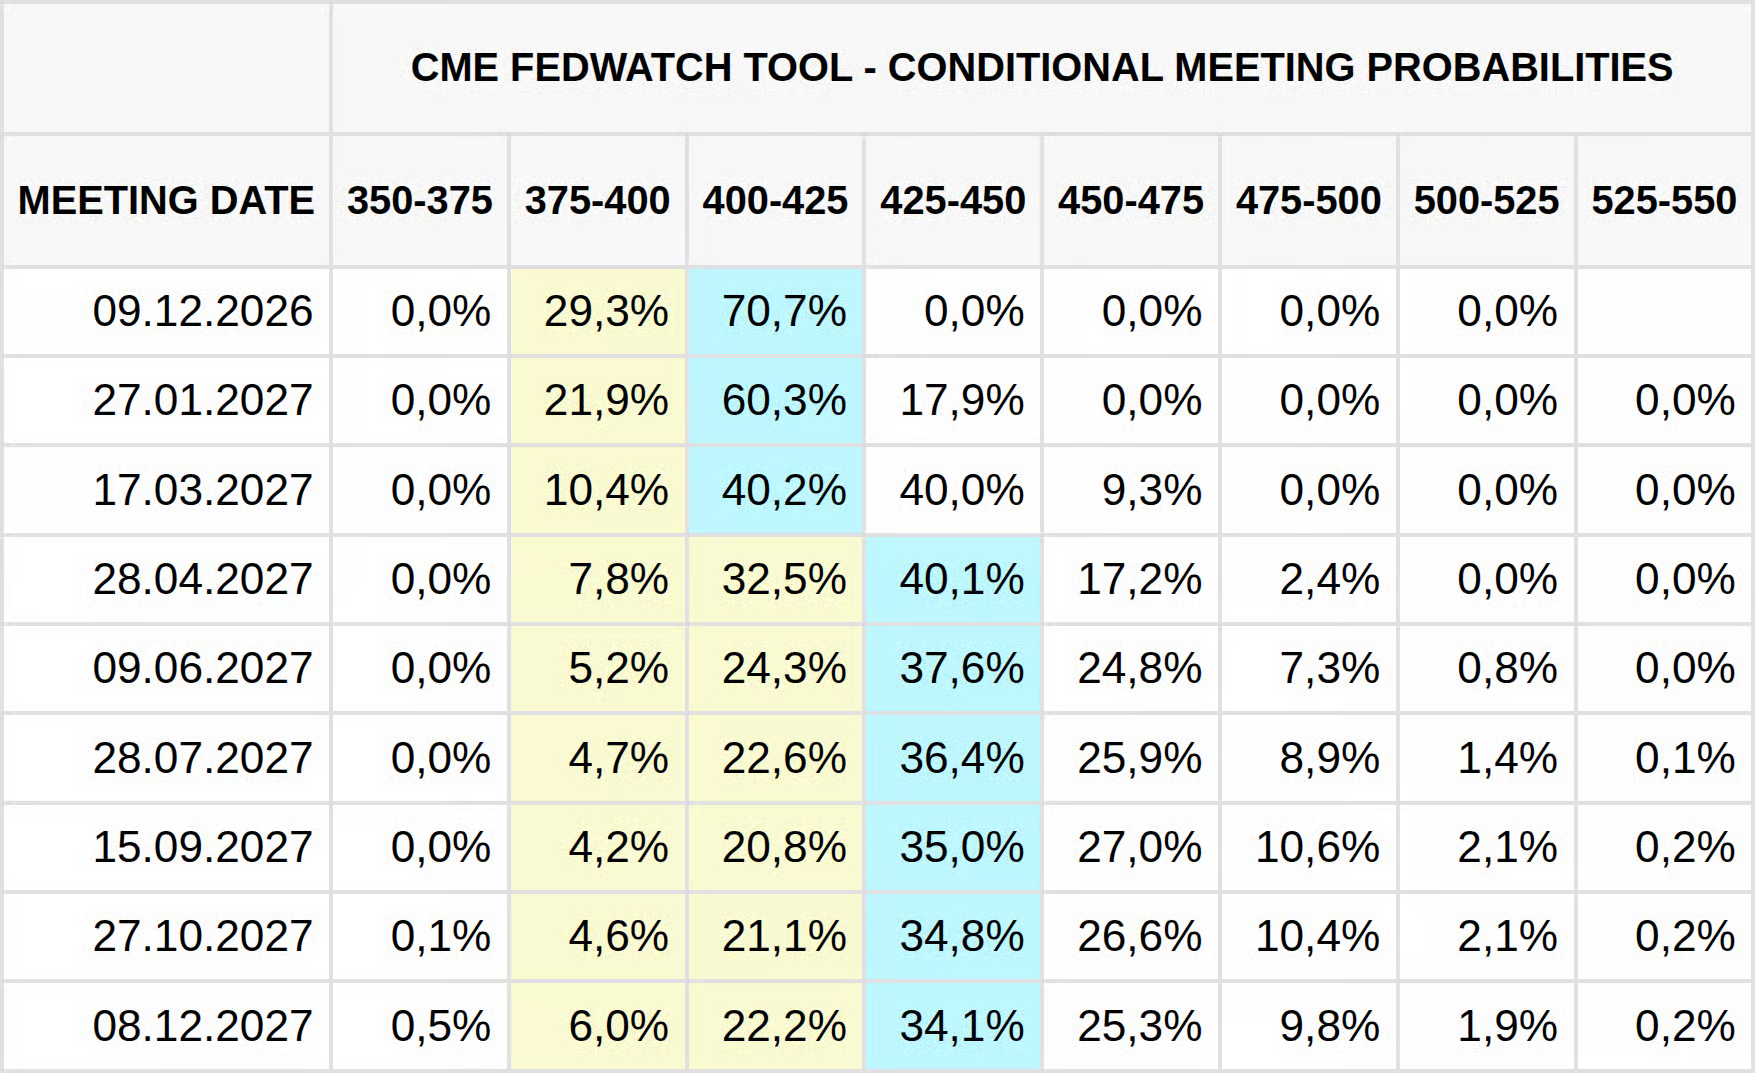
Stronger-than-expected employment data could reinforce expectations of a December Fed rate increase.
According to CME FedWatch, traders currently assign a 70.7% probability to that outcome.
Where Could Bitcoin Head Next?
Combining the different timeframes gives us a relatively clear picture.
The hourly chart shows a possible bullish RSI divergence. The four-hour chart remains bearish, with an unfilled FVG overhead and liquidity resting below recent lows.
On the daily chart, Bitcoin trades between the 200DEMA and 365DEMA. Meanwhile, the weekly chart is testing the crucial 50WMA near $75,800.
Bullish scenario
A recovery above $78,700 would represent the first meaningful improvement.
Bitcoin could then fill the FVG between $79,000 and $79,700 before challenging the substantial resistance zone between $80,500 and $82,000.
This area combines several technical and on-chain resistance levels, including the 50DMA and the estimated ETF cost basis.
Breaking above it would provide a stronger bullish signal.
Bearish scenario
A weekly close below $75,800 would be considerably more concerning.
Such a move would push Bitcoin below the 50WMA, the short-term holder cost basis and Strategy’s average purchase price.
The next downside target would be the demand zone around $74,900, followed by the broader support area between $73,500 and $75,200.
A decline toward $73,000 could also complete the right shoulder of a potential inverse head-and-shoulders formation.
Overall, I remain cautiously constructive over the medium term.
Short-term holders have shown signs of capitulation, sentiment is weak and the underlying cause of the sell-off is external to Bitcoin itself.
However, ETF outflows, weakness in technology stocks, expensive oil and political uncertainty create substantial short-term risks.
Another liquidity-driven decline would not surprise me.
My Trading Plan for the Coming Week
I closed my long positions on Thursday evening shortly after the Binance hack became public.
That decision proved sensible, as the subsequent decline would likely have triggered my stop-loss orders.
I am now considering whether to open new positions or wait until after the US elections.
For now, patience seems more appropriate.
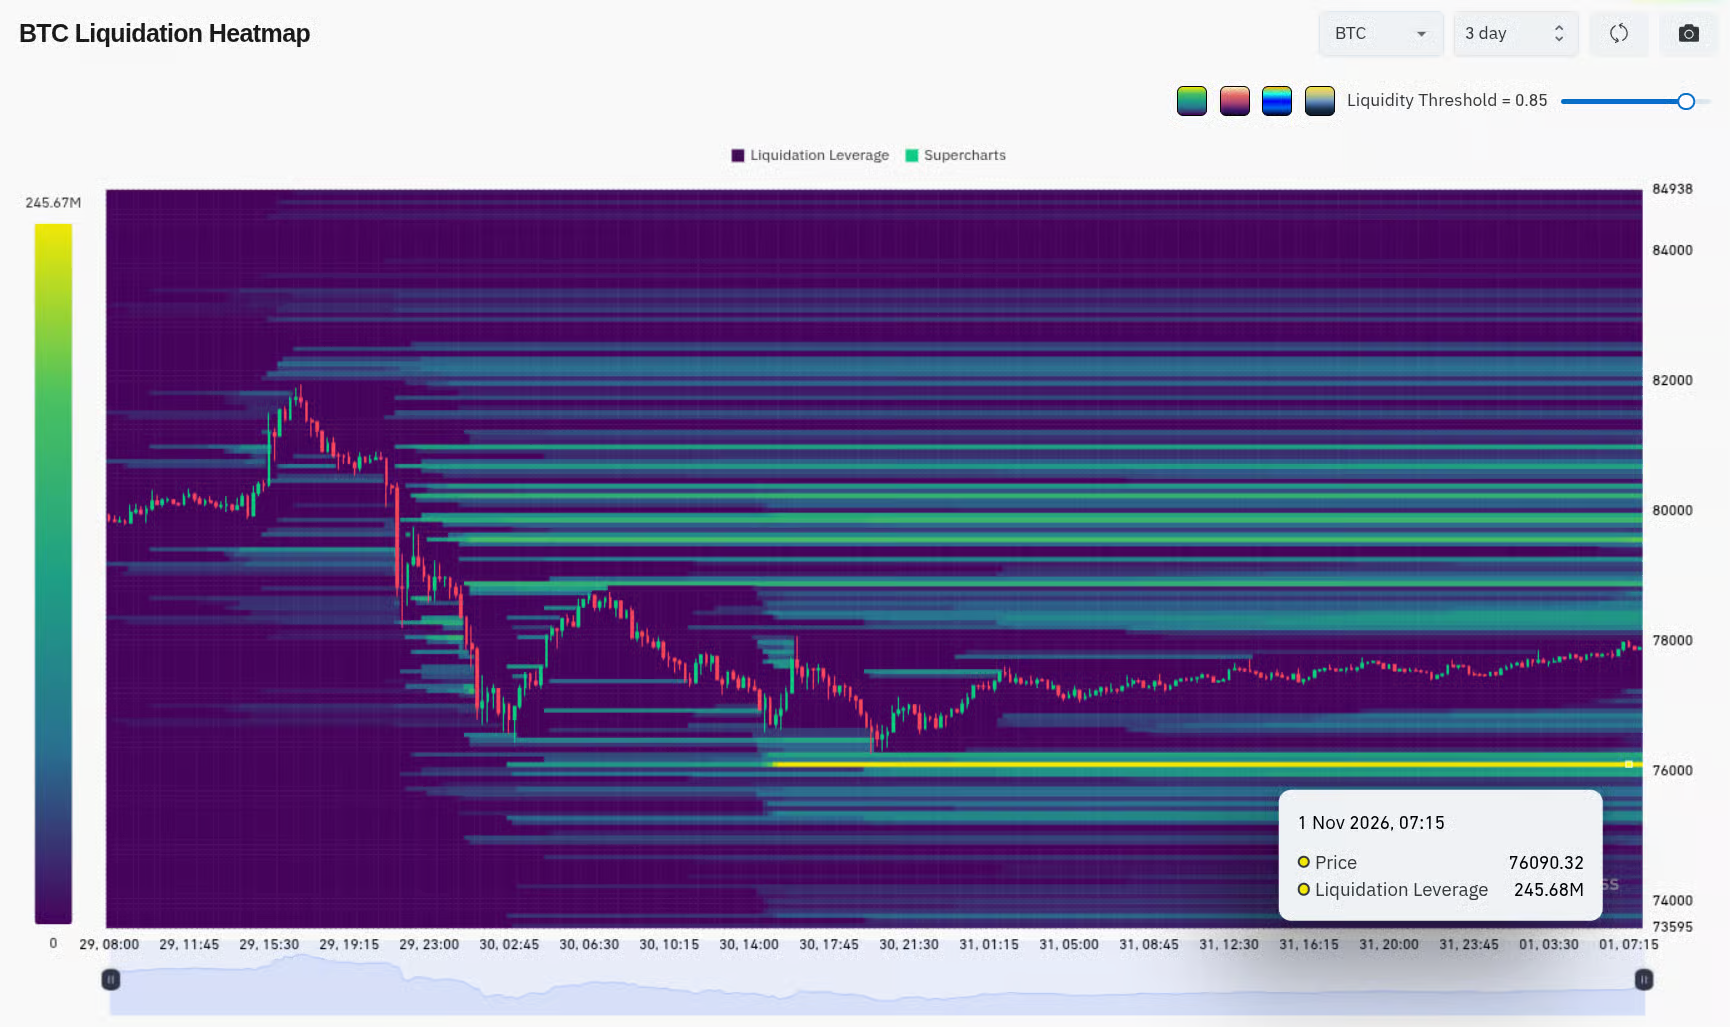
Significant liquidity has accumulated near $76,090 over the past three days. The market could revisit this area, particularly if technology stocks continue declining on Monday.
I expect considerable volatility around the elections and the upcoming economic releases.
Rather than entering positions during heightened uncertainty, I intend to wait until Wednesday for a clearer technical setup.
Missing one potential trade is preferable to entering the market without sufficient confirmation.
These observations reflect my personal market analysis and trading decisions. They should not be considered investment advice. Always conduct your own research, develop a trading strategy and manage your risk accordingly. DYOR.
