



The past week was dominated by the US midterm elections. Democrats gained control of Congress, stocks rallied on Wednesday, and Bitcoin surged to $81,163. Just one day later, however, technology stocks crashed, dragging Bitcoin down with them. The sell-off continued on Sunday, pushing Bitcoin toward $73,500. The cryptocurrency ultimately closed the week below its 50-week moving average (50WMA), confirming a significant technical breakdown. We will once again assess the current market situation and identify the strongest support and resistance levels.
As always, I will start by reviewing the week’s major events. Last Sunday, I outlined a scenario on the four-hour chart involving a liquidity sweep below Friday’s low around the elections, followed by a move to fill the liquidity gap and test the supply zone near $80,800. That is almost exactly what happened.
Early Wednesday morning, Bitcoin touched $76,100, sweeping liquidity around $76,090. A rally then followed, pushing the price to a weekly high of $81,163.
I also warned that the area between $80,500 and $82,000 would be difficult to break. And it was. Thursday brought a rejection, and on Friday, Bitcoin fell to $74,781.
The weekend initially looked relatively calm, with Bitcoin trading around $75,700, close to the 50WMA. However, Sunday’s late sell-off changed the situation dramatically.
Bitcoin briefly plunged toward $73,500 before recovering to close the week around $74,800–$75,000, depending on the exchange. This confirmed the fifth consecutive red weekly candle and a close below the key 50-week moving average.
On Monday morning, November 9, Bitcoin was trading around $74,200. The 50WMA, near $75,500, has therefore shifted from an important support level into potential resistance.
Strategy Bought More Bitcoin Than Strive
We entered the week around $78,000, briefly climbing toward $78,700 on Monday morning. Shortly after 2 p.m., Michael Saylor made another announcement.
Strategy had purchased 810 BTC for $65.5 million during the previous week, at an average price of $80,846. The company now holds 849,327 BTC, with an average acquisition price of $75,451.
It also spent another $208.2 million repurchasing STRC preferred shares. Meanwhile, Strive added 124 BTC, bringing its holdings to 43,124 BTC.
As usual, however, bullish news was followed by falling prices. Apple reported its earnings in the evening. Despite better-than-expected third-quarter results and revenue of $114.5 billion, its shares declined. Some of that pessimism spilled over into Bitcoin.
By Tuesday morning, Bitcoin had fallen toward $76,800. It then spent the entire day trading between $76,800 and $77,800. Trading volumes remained weak as investors waited for the election results.
At 4 p.m. Central European Time on Tuesday, we received the first indication of strength in the US labor market. September job openings, measured by JOLTS, unexpectedly increased by 333,000 to 7.523 million.
Analysts had expected just 7.10 million, while August’s figure was revised upward to 7.19 million. This marked the highest level in four months.
Layoffs also fell to their lowest level since March 2025, while the share of workers voluntarily leaving their jobs increased to 2.1%, the highest in more than a year.
In other words, workers appeared confident about their ability to find new employment.
Bitcoin showed little immediate reaction, but the figures sent a clear signal to the Federal Reserve: the labor market was certainly not cooling.
Democrats Won and Stocks Celebrated
Overnight, Bitcoin declined as markets anticipated the results of the US elections. At 4:09 a.m. on Wednesday, NBC News reported that Democrats had secured a majority in the House of Representatives.
Bitcoin was trading around $76,100 at that moment, but the price quickly reversed. This completed the liquidity sweep I had anticipated. Democrats eventually secured control of the Senate as well.
When US stock markets opened at 3:30 p.m. Central European Time, the Dow Jones jumped more than 1,100 points, while US equities gained over $1 trillion in market capitalization.
Wall Street’s initial reaction suggested that investors welcomed the prospect of divided government.
Bitcoin followed equities higher, reaching its weekly peak of $81,163 in the afternoon. US spot Bitcoin exchange-traded funds (ETFs) recorded net inflows of $74.6 million on Wednesday. It was their only positive day of the week.
Thursday’s Technology Stock Crash
Bitcoin was holding near $80,800 on Thursday morning. However, investors then began to realize what the election results could mean for artificial intelligence and the broader technology sector.
Hundreds of candidates who had promised to restrict data center construction won their races. Among them was Gina Hinojosa, the newly elected governor of Texas, the state with the largest data center market in the United States.
When the stock market opened at 3:30 p.m., technology shares plunged. According to The Kobeissi Letter, the sector erased $1.3 trillion in market value within just 30 minutes.
The Nasdaq 100 eventually lost more than 6%, wiping out approximately $2.3 trillion. According to Bloomberg, this represented the largest single-day loss in dollar terms on record.
The Nasdaq Composite dropped 5.52%, entering correction territory and falling below its 200-day moving average for the first time since April.
SanDisk shares lost 22%, while Micron and AMD declined 17%. Semiconductor stocks experienced their second-largest daily decline in history.
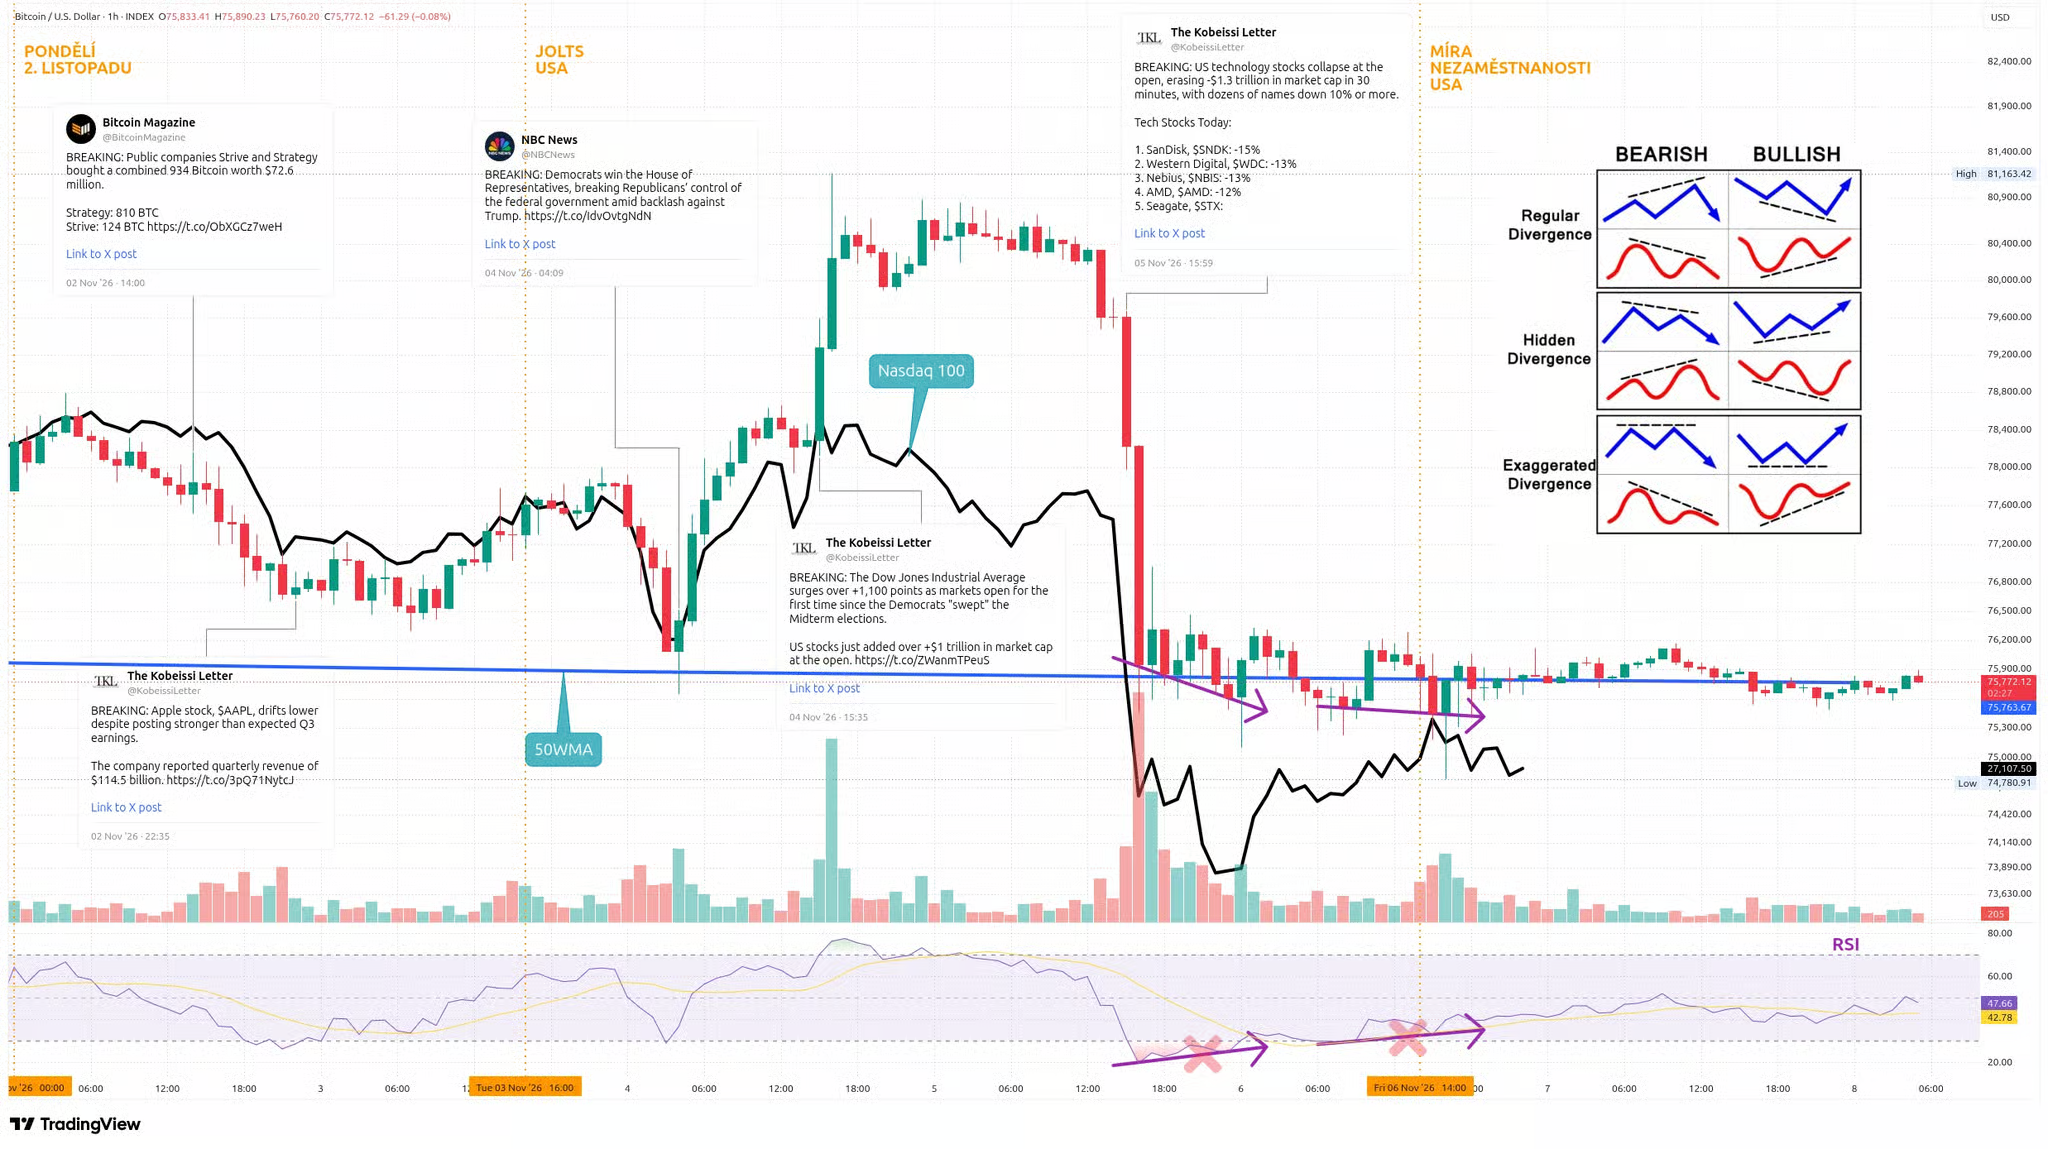
The hourly chart clearly illustrates how closely Bitcoin followed technology stocks. I have marked the Nasdaq 100 with a black line.
Within just a few hours, Bitcoin plunged from $79,800 to $76,000, while the Relative Strength Index (RSI) dropped deep into oversold territory, below 25.
Spot Bitcoin ETFs recorded outflows of $430.2 million, primarily from Fidelity’s FBTC ($199.9 million) and BlackRock’s IBIT ($105 million).
According to the CME FedWatch Tool, traders pushed back their expectations for the next interest rate hike until March. Unfortunately, that provided little support to the market at the time.
Strong Employment Data Revived Expectations of a December Rate Hike
A bullish divergence began forming overnight into Friday. Bitcoin was making lower lows while the RSI was making higher lows. However, the signal did not hold.
At 2:30 p.m. Central European Time on Friday, another US employment report delivered a major surprise, following Tuesday’s stronger-than-expected JOLTS figures.
Instead of the approximately 62,000 to 70,000 new jobs analysts had anticipated, the economy added 165,000 positions. September’s employment figure was also revised upward from 29,000 to 60,000.
The unemployment rate declined from 4.2% to 4.1%, while average hourly earnings increased by 0.4% month over month.
A strong economy, however, gives the Federal Reserve another reason to raise interest rates. According to the CME FedWatch Tool, the probability of a December rate hike jumped back toward 77%.
Bitcoin reacted by falling to Friday’s low of $74,781.
Spot Bitcoin ETFs suffered another $411.9 million in outflows on Friday, almost entirely driven by IBIT ($403 million). Fidelity, by contrast, attracted $42.8 million.
For the entire week, ETFs recorded net outflows of $1.28 billion, their largest weekly withdrawal since late June. This pushed their year-to-date balance to a negative $914 million. Hardly encouraging.
Saturday remained relatively quiet, with Bitcoin trading around $75,800, almost exactly at the 50WMA.
Another bullish divergence attempted to form on the hourly chart, but it also appeared to expire without producing a meaningful reaction. At that point, the RSI stood near 47.
Sunday evening then brought another wave of selling. Bitcoin broke below Friday’s low and briefly dropped toward $73,500 before recovering.
The weekly close below the 50WMA confirmed that buyers had failed to defend this critical level.
The question is no longer whether the moving average can hold as support. Instead, we must now watch whether Bitcoin can reclaim it.
Four-Hour Chart Shows a Bear Flag
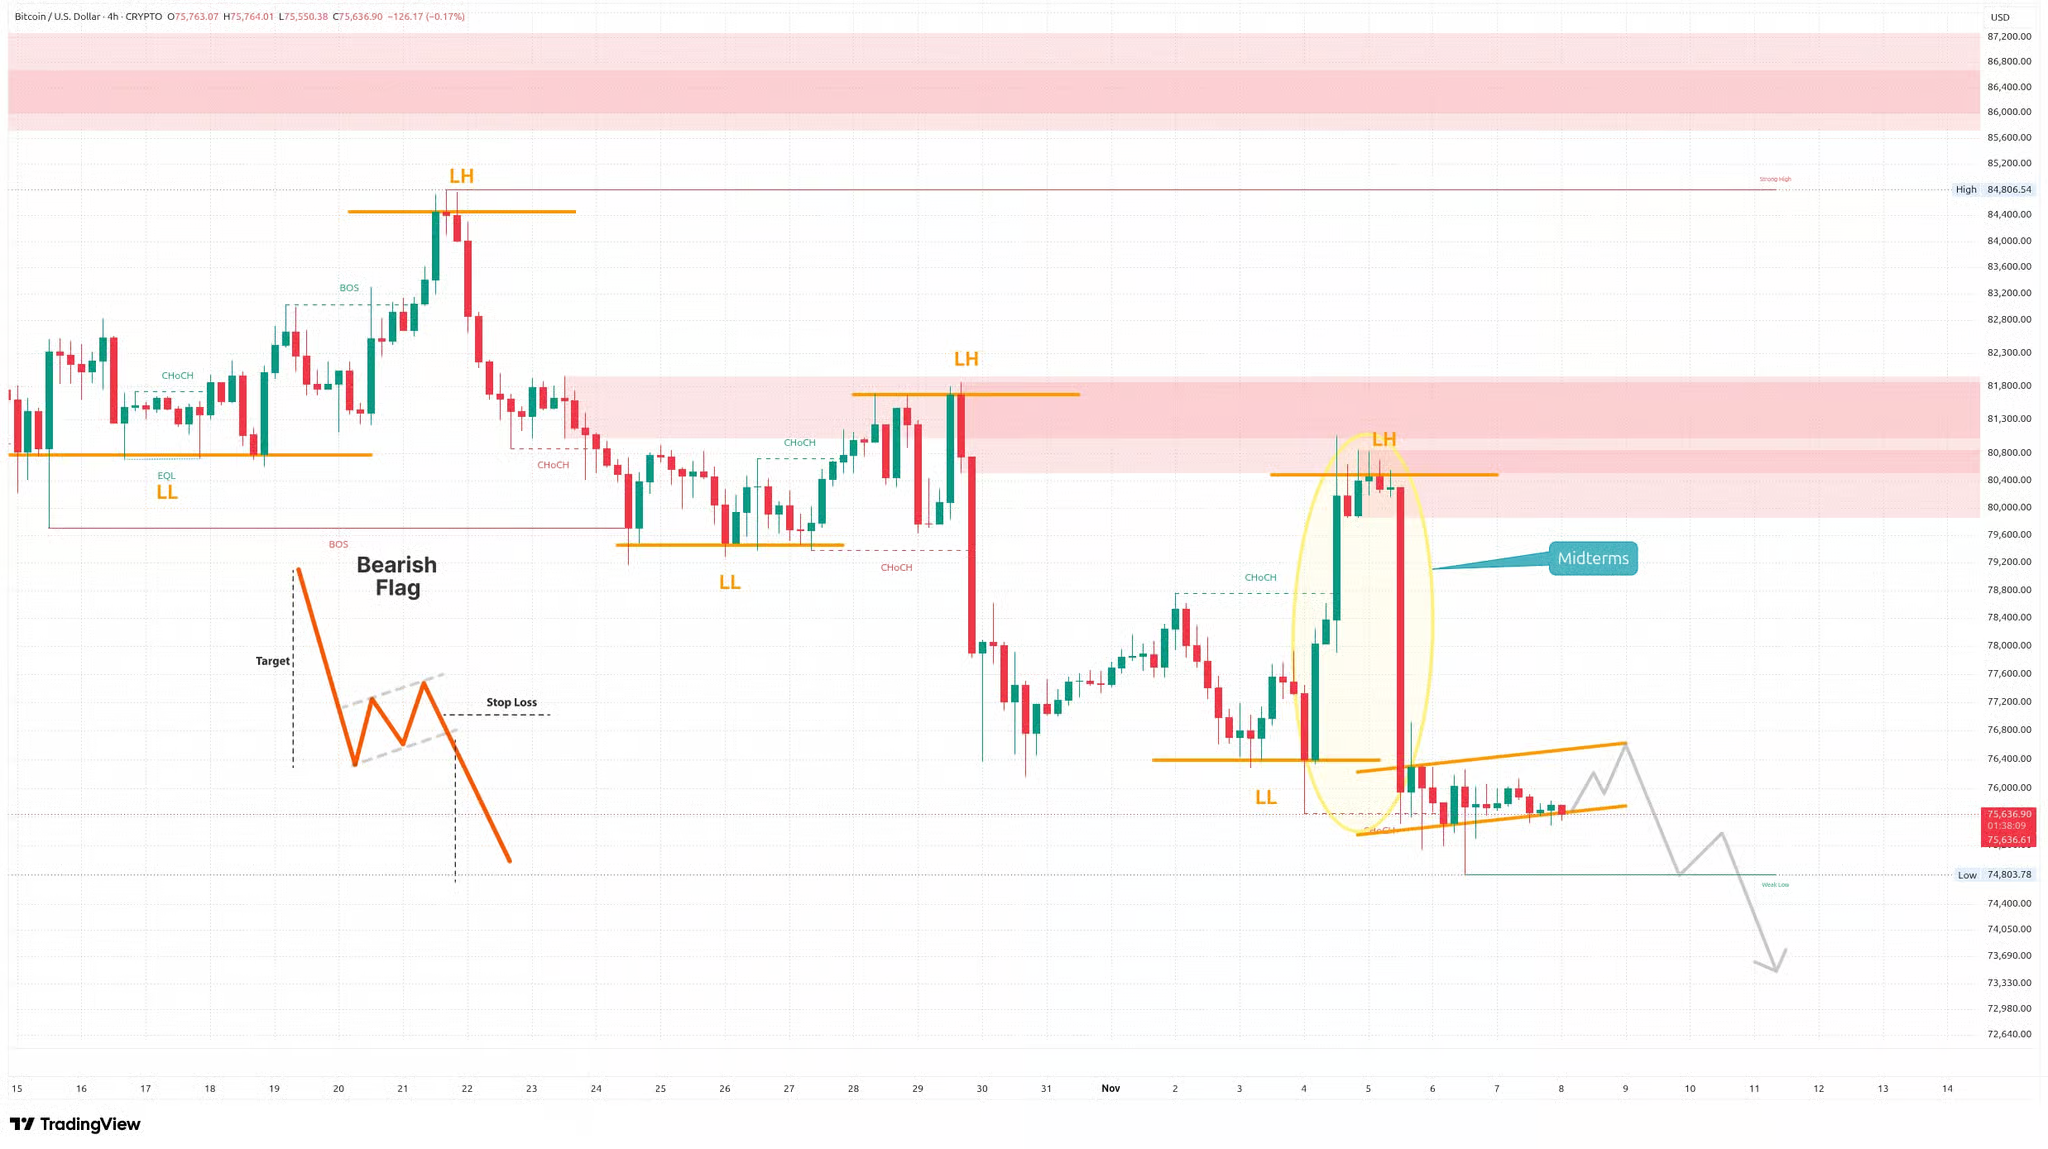
Last week, I highlighted a bearish market structure based on Smart Money Concepts (SMC) on the four-hour chart. That structure remains intact.
Wednesday’s election-driven rally created another lower high (LH) near $80,600. The rejection occurred precisely within the supply zone between $79,900 and $81,900, marked in red. Bitcoin subsequently established another lower low (LL).
Ahead of Sunday’s decline, a potential bear flag was also forming above Friday’s low.
Following Thursday’s sharp decline, Bitcoin had been recovering slowly within a slightly ascending channel between approximately $75,300 and $76,700.
A bear flag is typically a continuation pattern. A breakdown below the channel often signals another downward move.
Friday’s low near $74,800 was also classified as a weak low.
I had drawn a gray line illustrating what seemed to me the most likely scenario. First, Bitcoin could test the upper boundary of the flag near $76,700. This could be followed by a breakdown below Friday’s low and another decline.
Sunday’s sharp move below $74,800 showed that the bearish scenario was already beginning to materialize.
However, Bitcoin has not yet reached the deeper target around $71,500.
For now, the former support zone between $75,300 and $76,700 represents an important area to reclaim.
A sustained recovery above the channel’s upper boundary, particularly above the supply zone, would weaken the bearish outlook.
Daily Chart Offers a Bullish Divergence
Last week, I focused on the 200-day and 365-day exponential moving averages (200DEMA and 365DEMA) on the daily chart.
Bitcoin remained between them until Thursday, when the technology stock crash pushed the price lower.
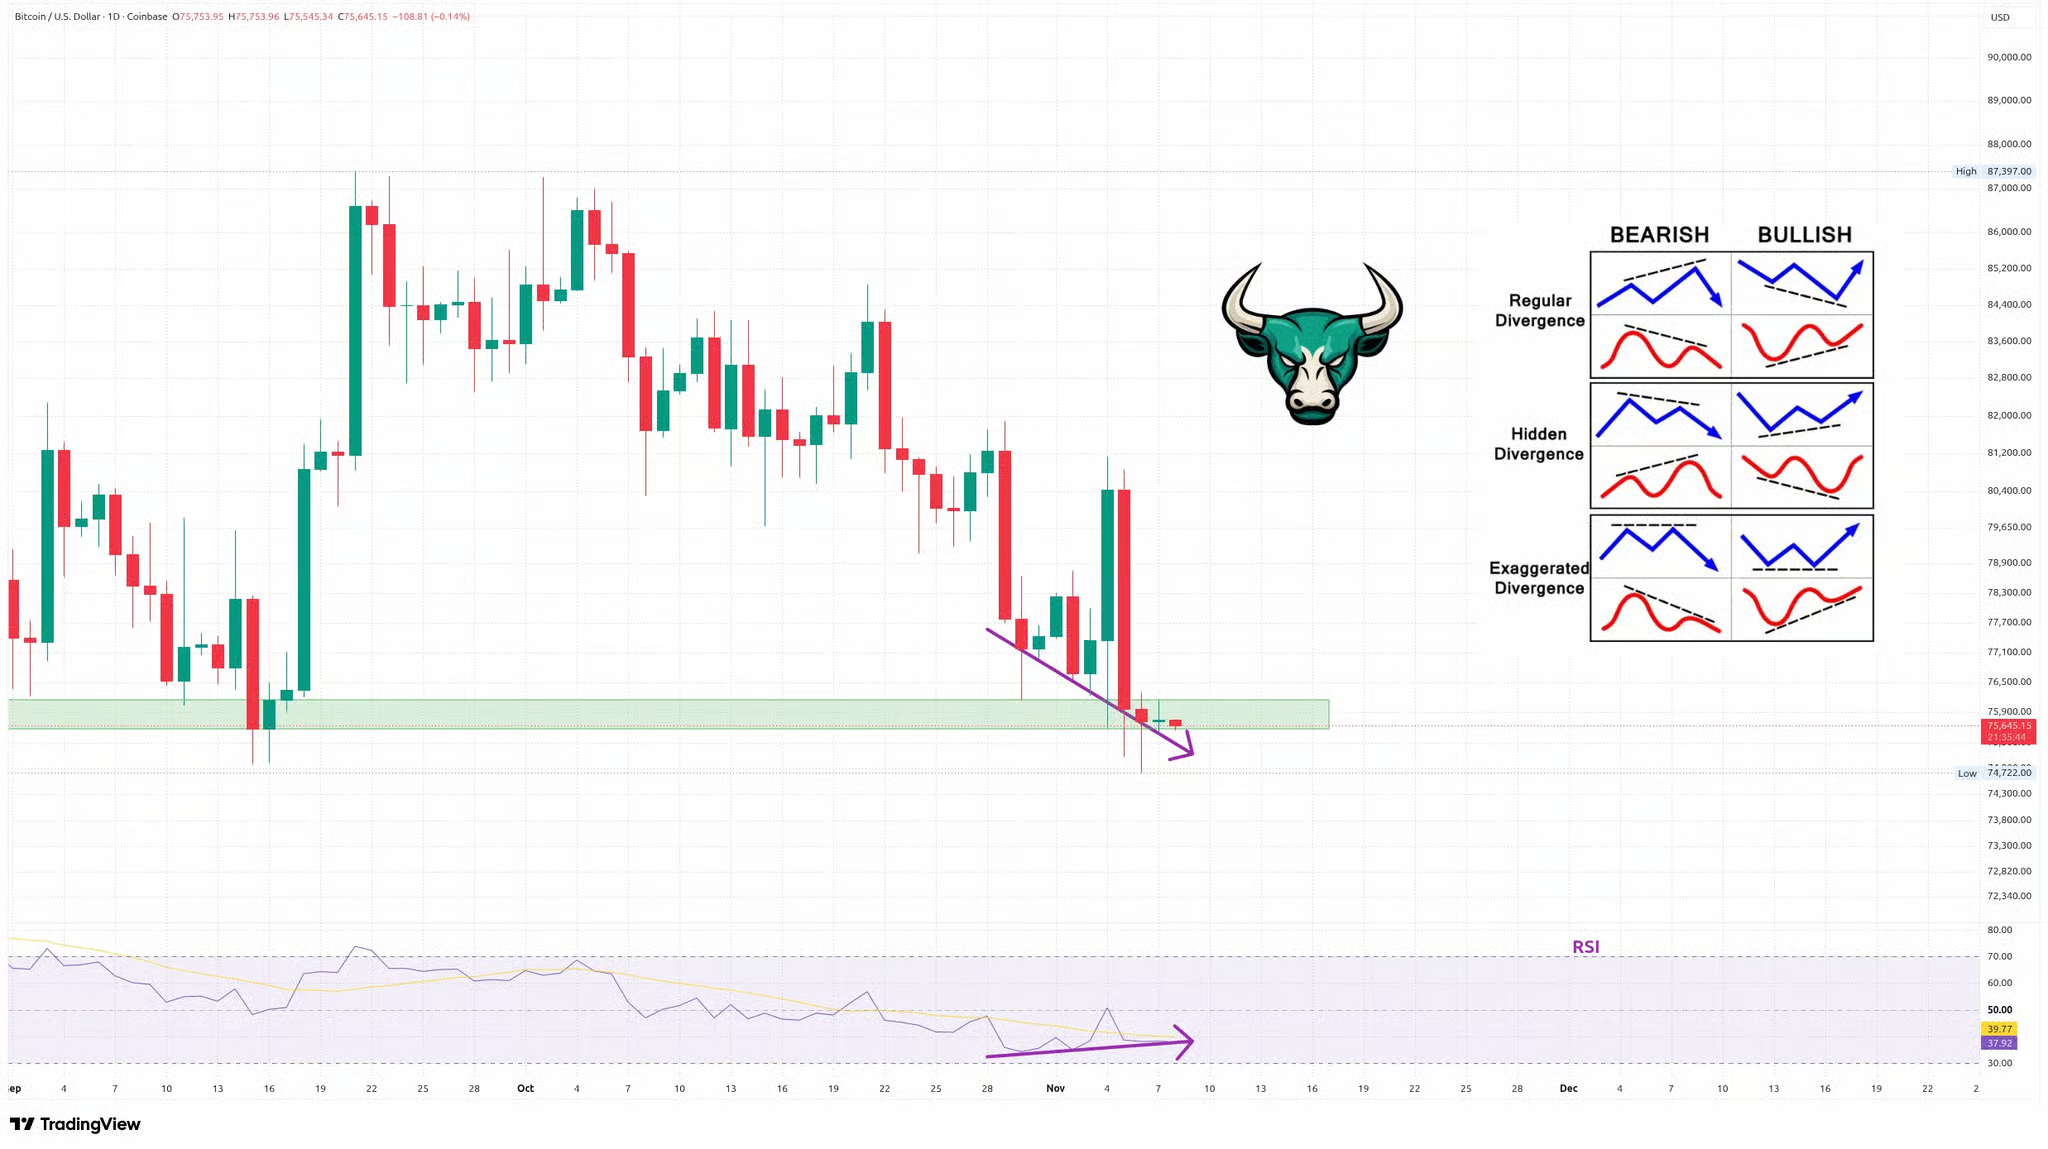
I therefore simplified the chart, focusing primarily on the support zone between $75,600 and $76,200, highlighted in green.
This zone had supported Bitcoin since mid-September. On Friday, the price briefly broke below it, with a wick reaching $74,722.
At that point, I saw at least some reason for optimism.
Since late October, Bitcoin had been forming lower lows while the RSI was making higher lows. This represented a classic bullish divergence.
The RSI stood at 38, slightly below its moving average, and had not even entered oversold territory below 30.
Friday’s candle also featured a long lower wick, suggesting that buyers remained active at those levels.
However, the divergence still required confirmation. We needed to see a stronger green candle and the RSI moving back above its average.
Sunday’s decline complicated this setup considerably.
Bitcoin broke below the green support zone again and established another lower low near $73,500.
The original bullish divergence must therefore be reassessed using the latest daily candle.
Monday’s daily RSI was around 35, indicating weak momentum and proximity to oversold conditions.
A recovery above $75,600–$76,200 would improve the outlook, particularly if accompanied by strengthening RSI.
Until then, the loss of this support zone remains a warning sign.
Weekly Chart Awaits the Right Shoulder
Last week, I identified the 50WMA as a critical support level on the weekly chart.
Bitcoin initially appeared capable of defending it, but Sunday’s late sell-off changed the picture.
The week ended below the moving average, confirming the fifth consecutive red weekly candle.
This is a significant technical development. The 50WMA had provided important support since September, and losing it increases the risk of further downside.
Today, I am therefore returning to the inverse Head and Shoulders pattern that I first discussed in October.
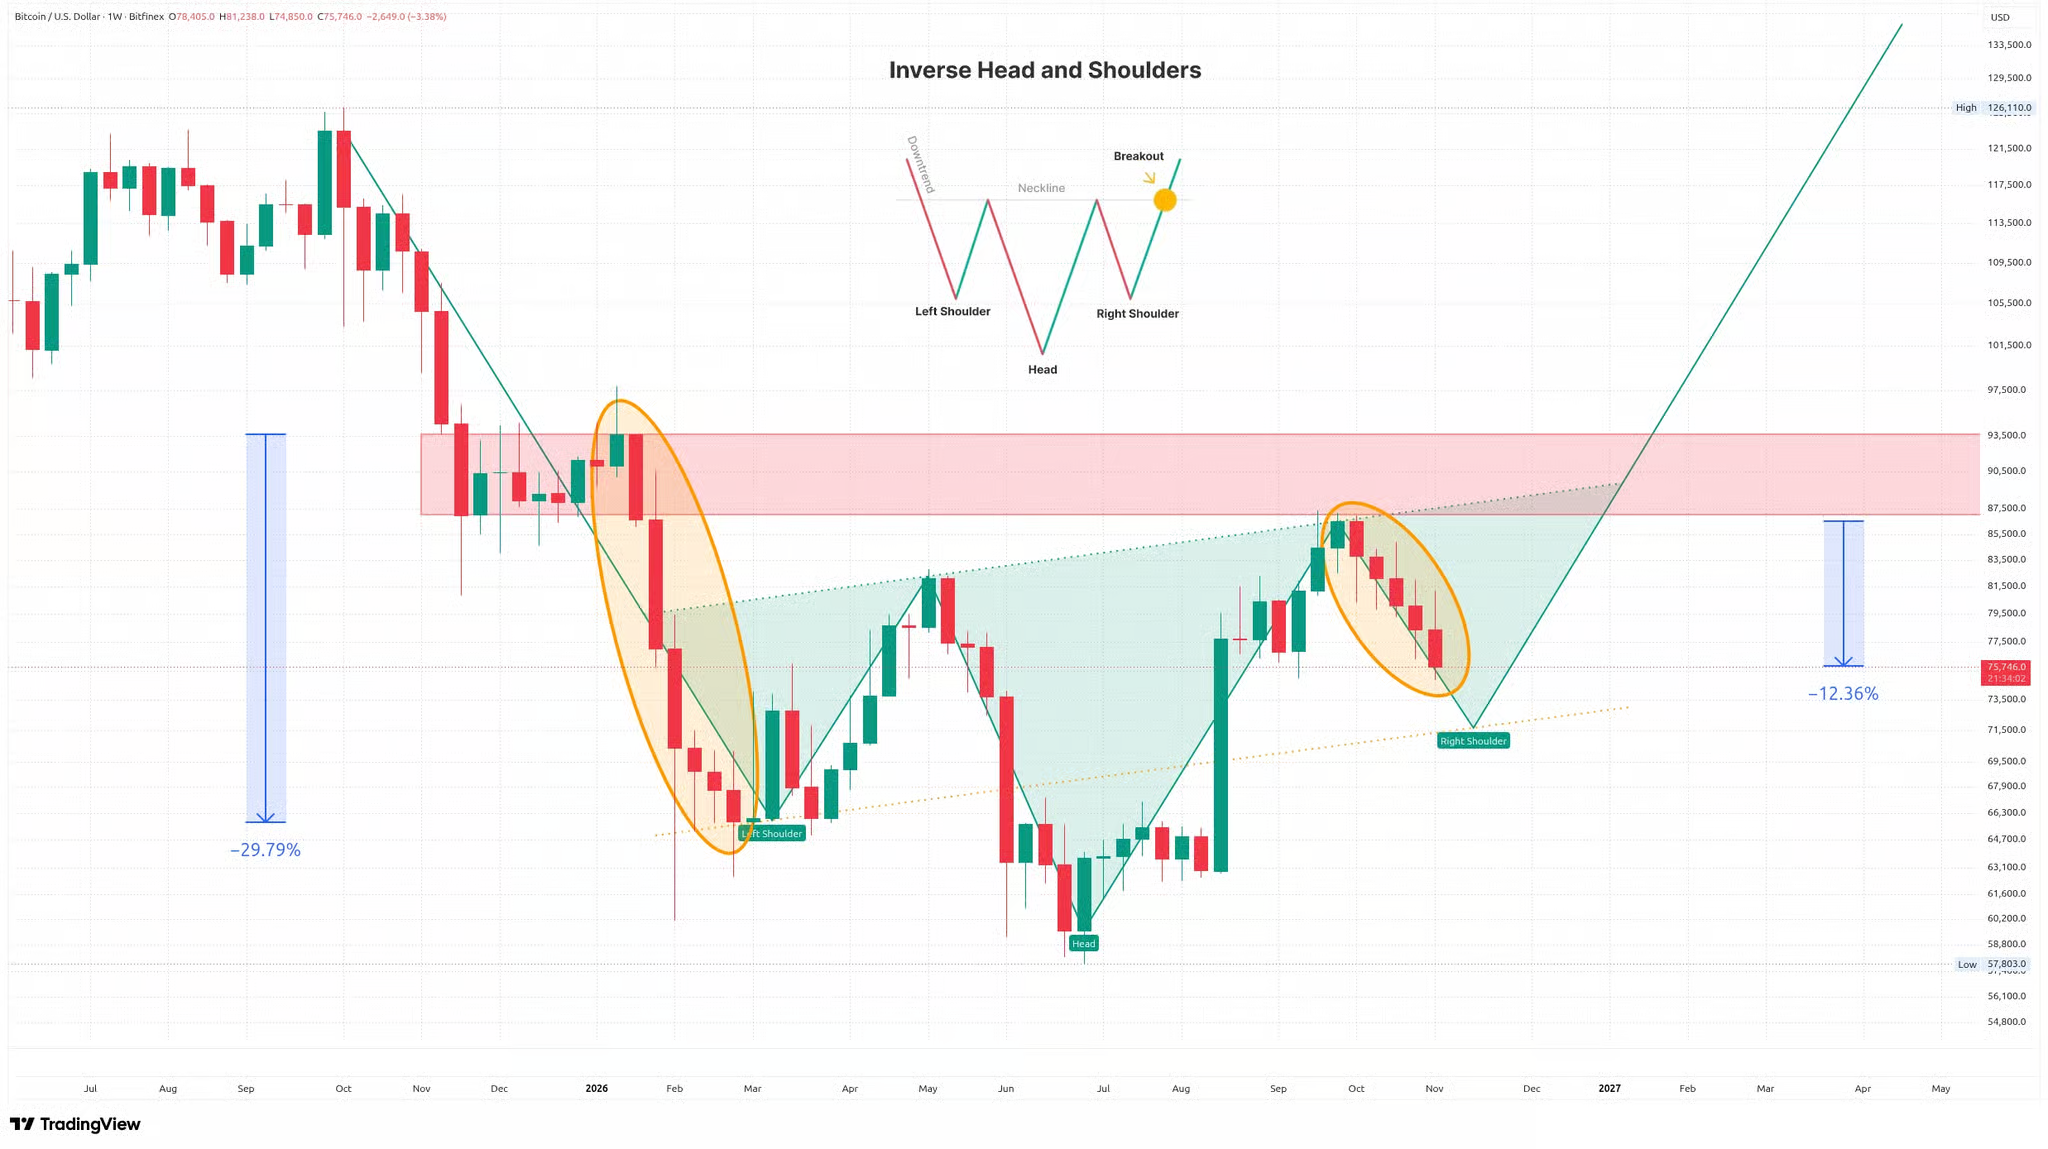
The head is formed by June’s low of $57,803, while the left shoulder consists of the February and March lows near $65,000.
The right shoulder could theoretically develop around $71,500, where a parallel line extending from the left shoulder’s neckline runs. I have marked this line with orange dots.
The neckline itself slopes upward toward the resistance zone between $87,000 and $93,500, highlighted in red.
Only a breakout above this zone would open the door to further gains.
Comparing the two declines is also interesting.
The drop from January’s peak to the left shoulder measured 29.79%. Before Sunday’s sell-off, the current decline from October’s peak stood at approximately 12.36%.
The latest decline has increased that correction, bringing Bitcoin closer to the potential right shoulder.
I have highlighted both moves in orange to show how similar their structures appear.
If the right shoulder were to form around $71,500, the decline would reach approximately 18%, preserving the overall symmetry of the pattern.
The recent breakdown does not automatically invalidate the inverse Head and Shoulders scenario.
In fact, a deeper correction could still form part of the right shoulder.
However, the bulls now face an additional challenge. Bitcoin must reclaim the 50WMA before a more convincing recovery can begin.
Where Are the Strongest Support Levels?
I will once again start with realized prices, or cost bases.
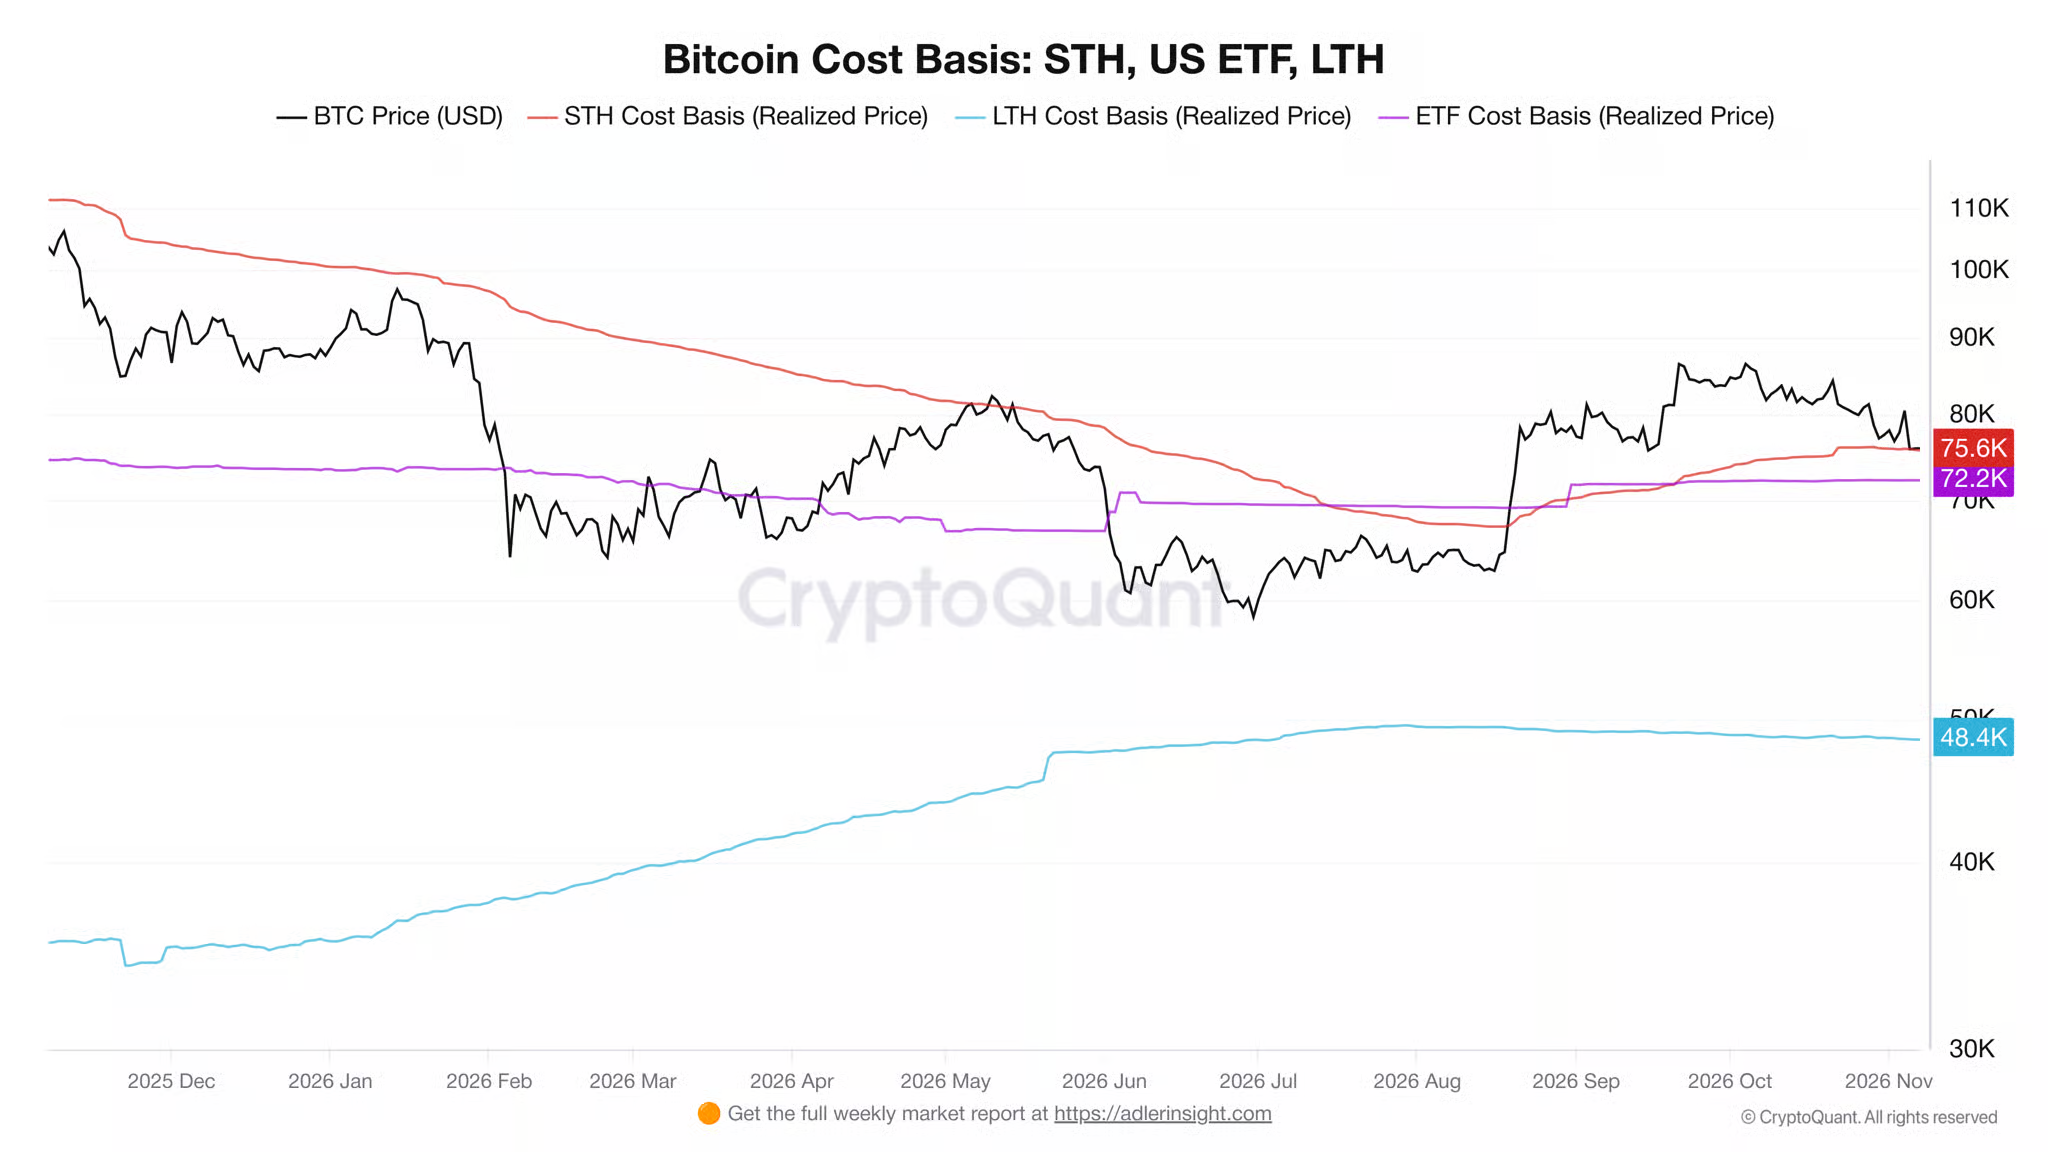
According to CryptoQuant, the average acquisition price of short-term holders (STH) stands at $75,600. For spot Bitcoin ETFs, it is $72,200, while long-term holders (LTH) have an average acquisition price of $48,400.
At the beginning of the weekend, Bitcoin was trading almost exactly at the cost basis of short-term holders.
Sunday’s decline pushed the price clearly below this level.
This makes the situation more difficult for short-term investors, who are increasingly holding unrealized losses.
When Bitcoin traded above $86,000, short-term holders held nearly $49 billion in unrealized profits.
Before Sunday’s decline, they had already slipped into a net unrealized loss of approximately $162 million.
The latest sell-off has increased pressure on this group.
This is often the point at which investors decide whether to accumulate more Bitcoin or sell their holdings.
The ETF cost basis near $72,200 now deserves particular attention.
With Bitcoin trading around $74,200 on Monday morning, this level sits less than 3% below the market price.
The chart shows that Bitcoin last fell below the ETF cost basis in February and remained there until August. That was the most difficult period of the year for ETF investors.
Meanwhile, the cost basis of long-term holders has increased from approximately $36,000 to $48,000 this year.
This happens because coins purchased at higher prices gradually mature into the long-term holder category.
However, their cost basis has remained relatively stable since August.
Long-term holders are therefore still sitting on substantial profits, and I do not see significant selling pressure coming from this group.
Have Sellers Run Out of Steam?
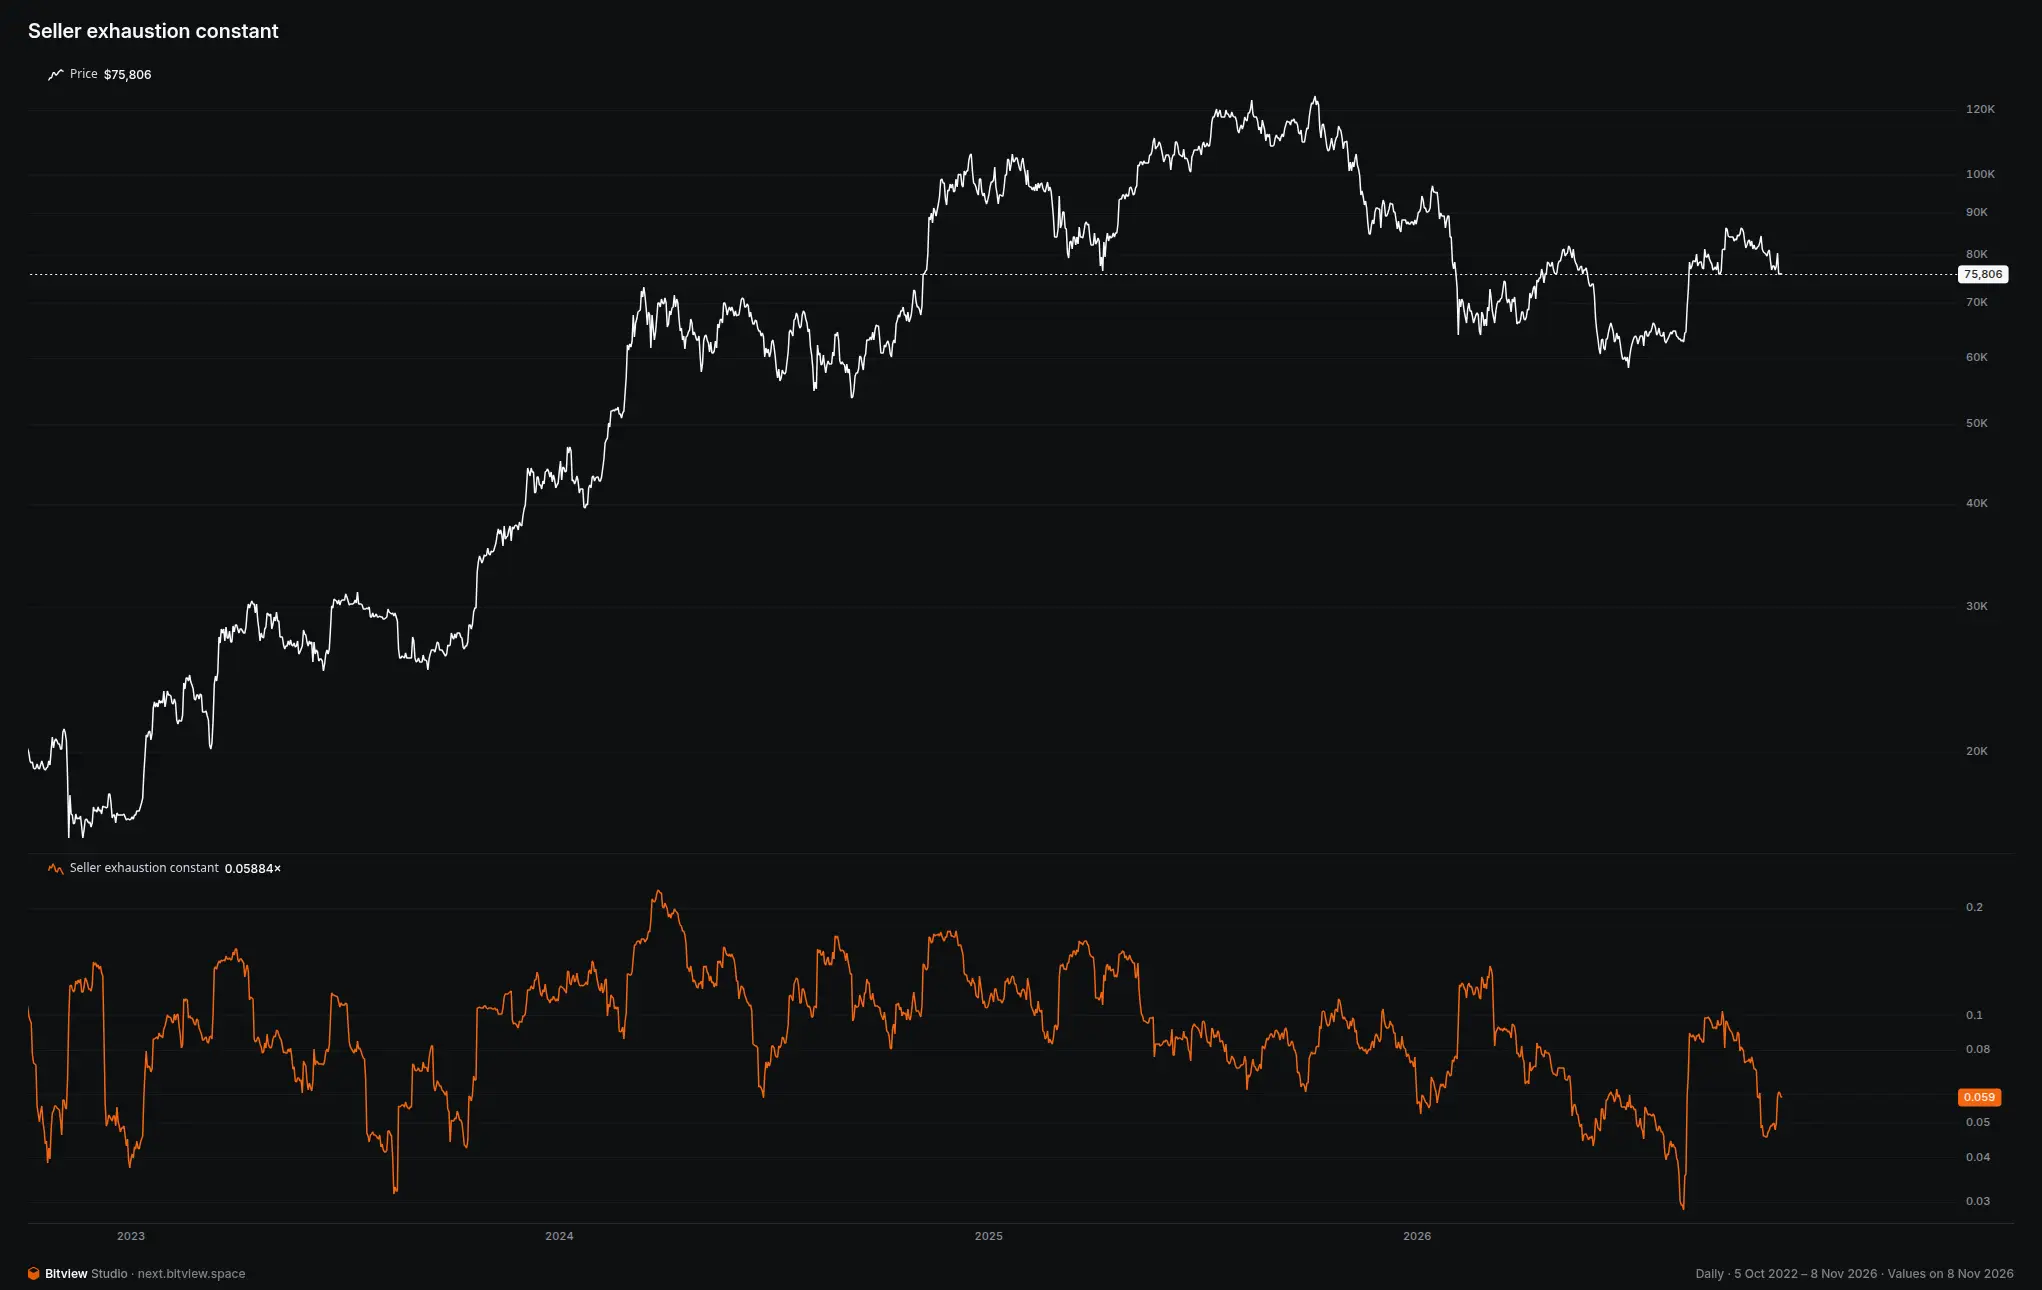
I am also monitoring the Seller Exhaustion model.
This indicator compares the percentage of coins in profit with average monthly volatility.
When its value falls to low levels, it suggests that sellers have limited remaining capacity to push prices lower.
According to the chart, the metric has returned to levels last seen during the depths of the bear market.
That makes sense. Much of the short-term profit has already been realized, and the correction from the recent peak has exceeded 10%.
Historically, such a reduction in selling pressure has created conditions for a market bottom.
However, this does not automatically mean that a recovery will follow.
Even if sellers have become less aggressive, a sustainable rally still requires demand. And that is exactly what the market currently lacks.
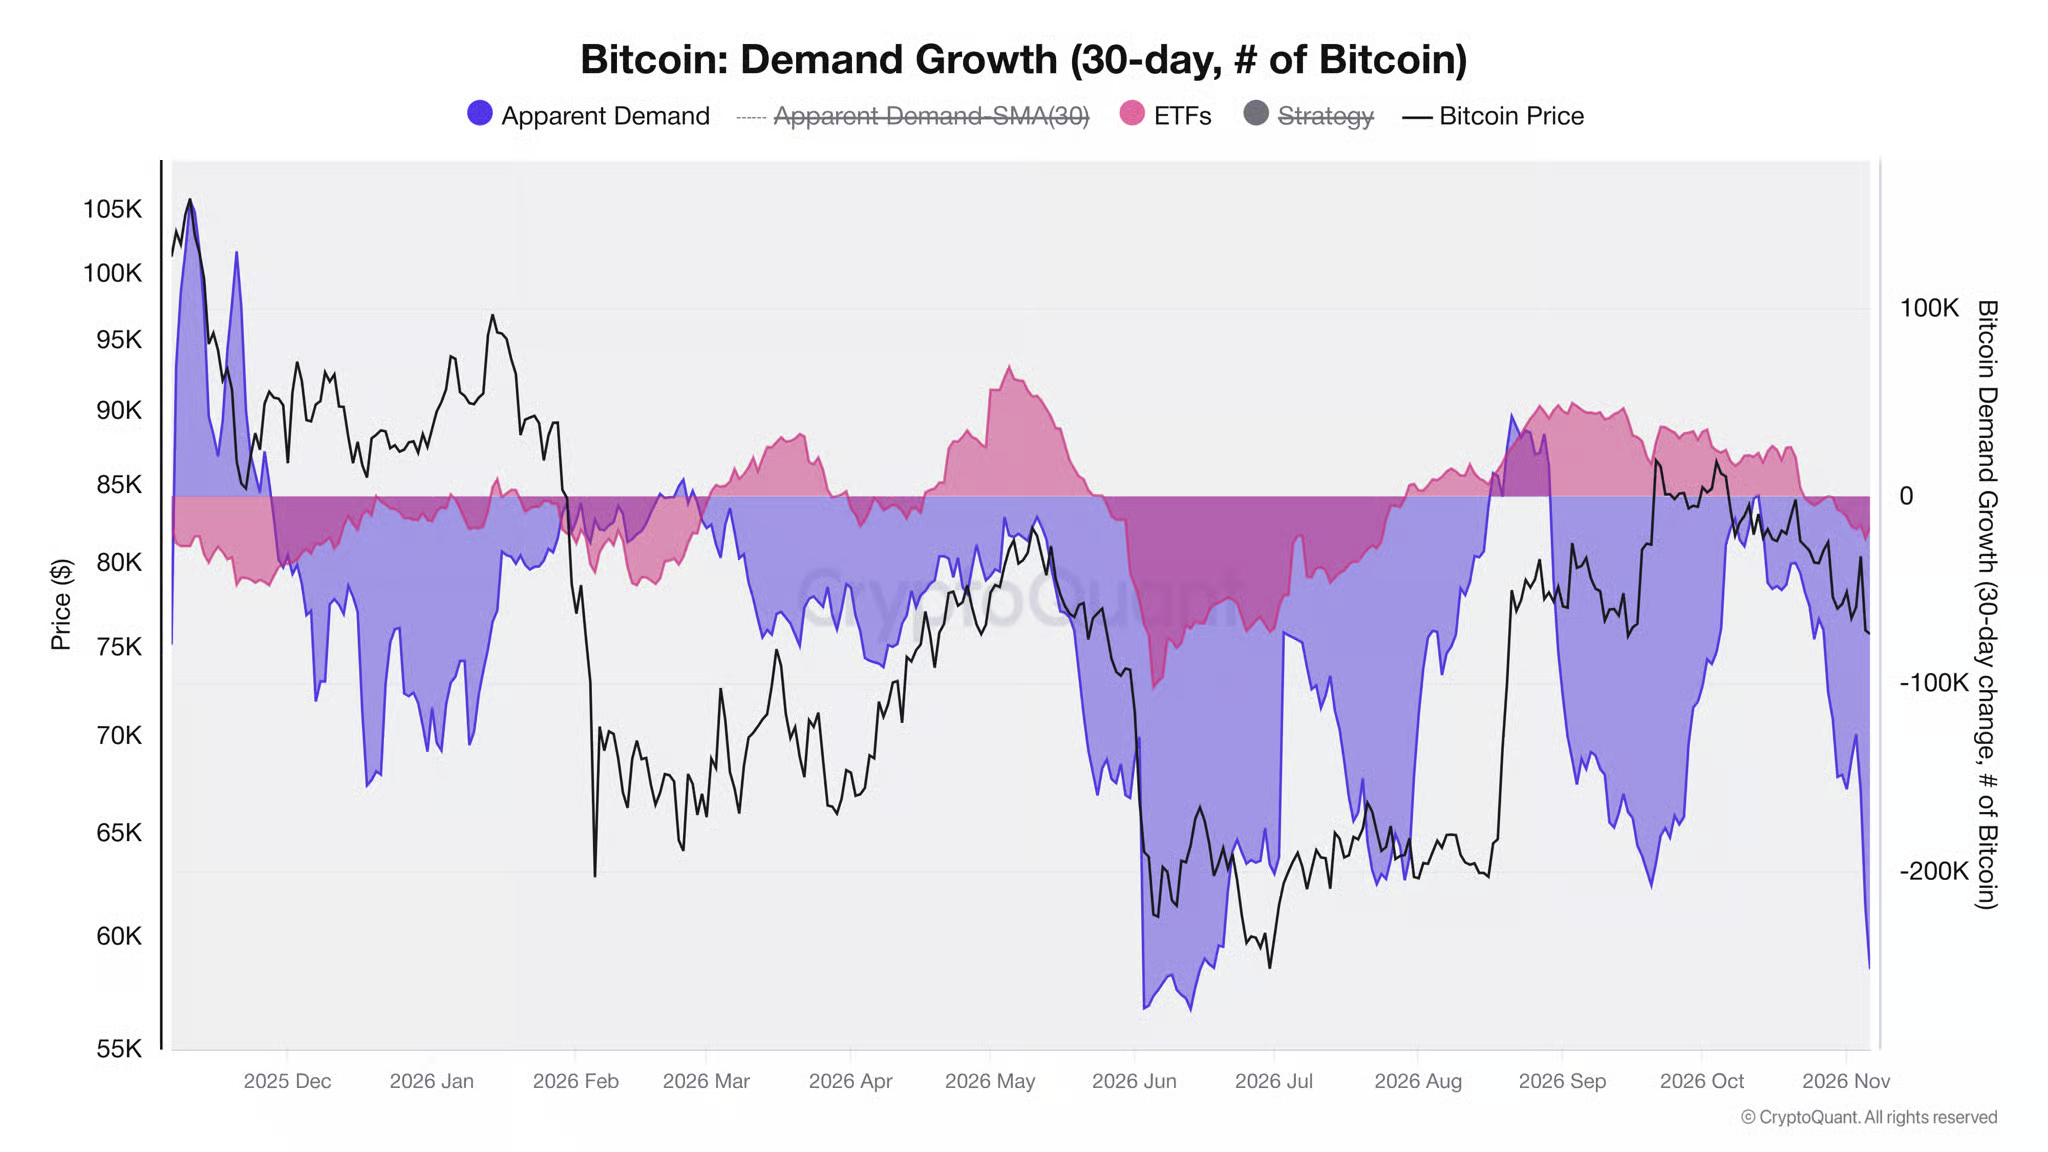
The Apparent Demand chart confirms this weakness.
This metric compares changes in circulating Bitcoin supply with newly mined coins and the supply held by long-term investors.
Apparent Demand stood at negative 251,000 BTC, below its August level and approaching June’s low of negative 273,000 BTC.
Spot Bitcoin ETFs also suffered $1.28 billion in outflows last week, once again returning to substantial withdrawals.
Overall, however, we appear to be approaching an extreme.
Bitcoin often deserves the most attention precisely when everyone else starts losing interest.
Historically, these periods have sometimes offered attractive buying opportunities.
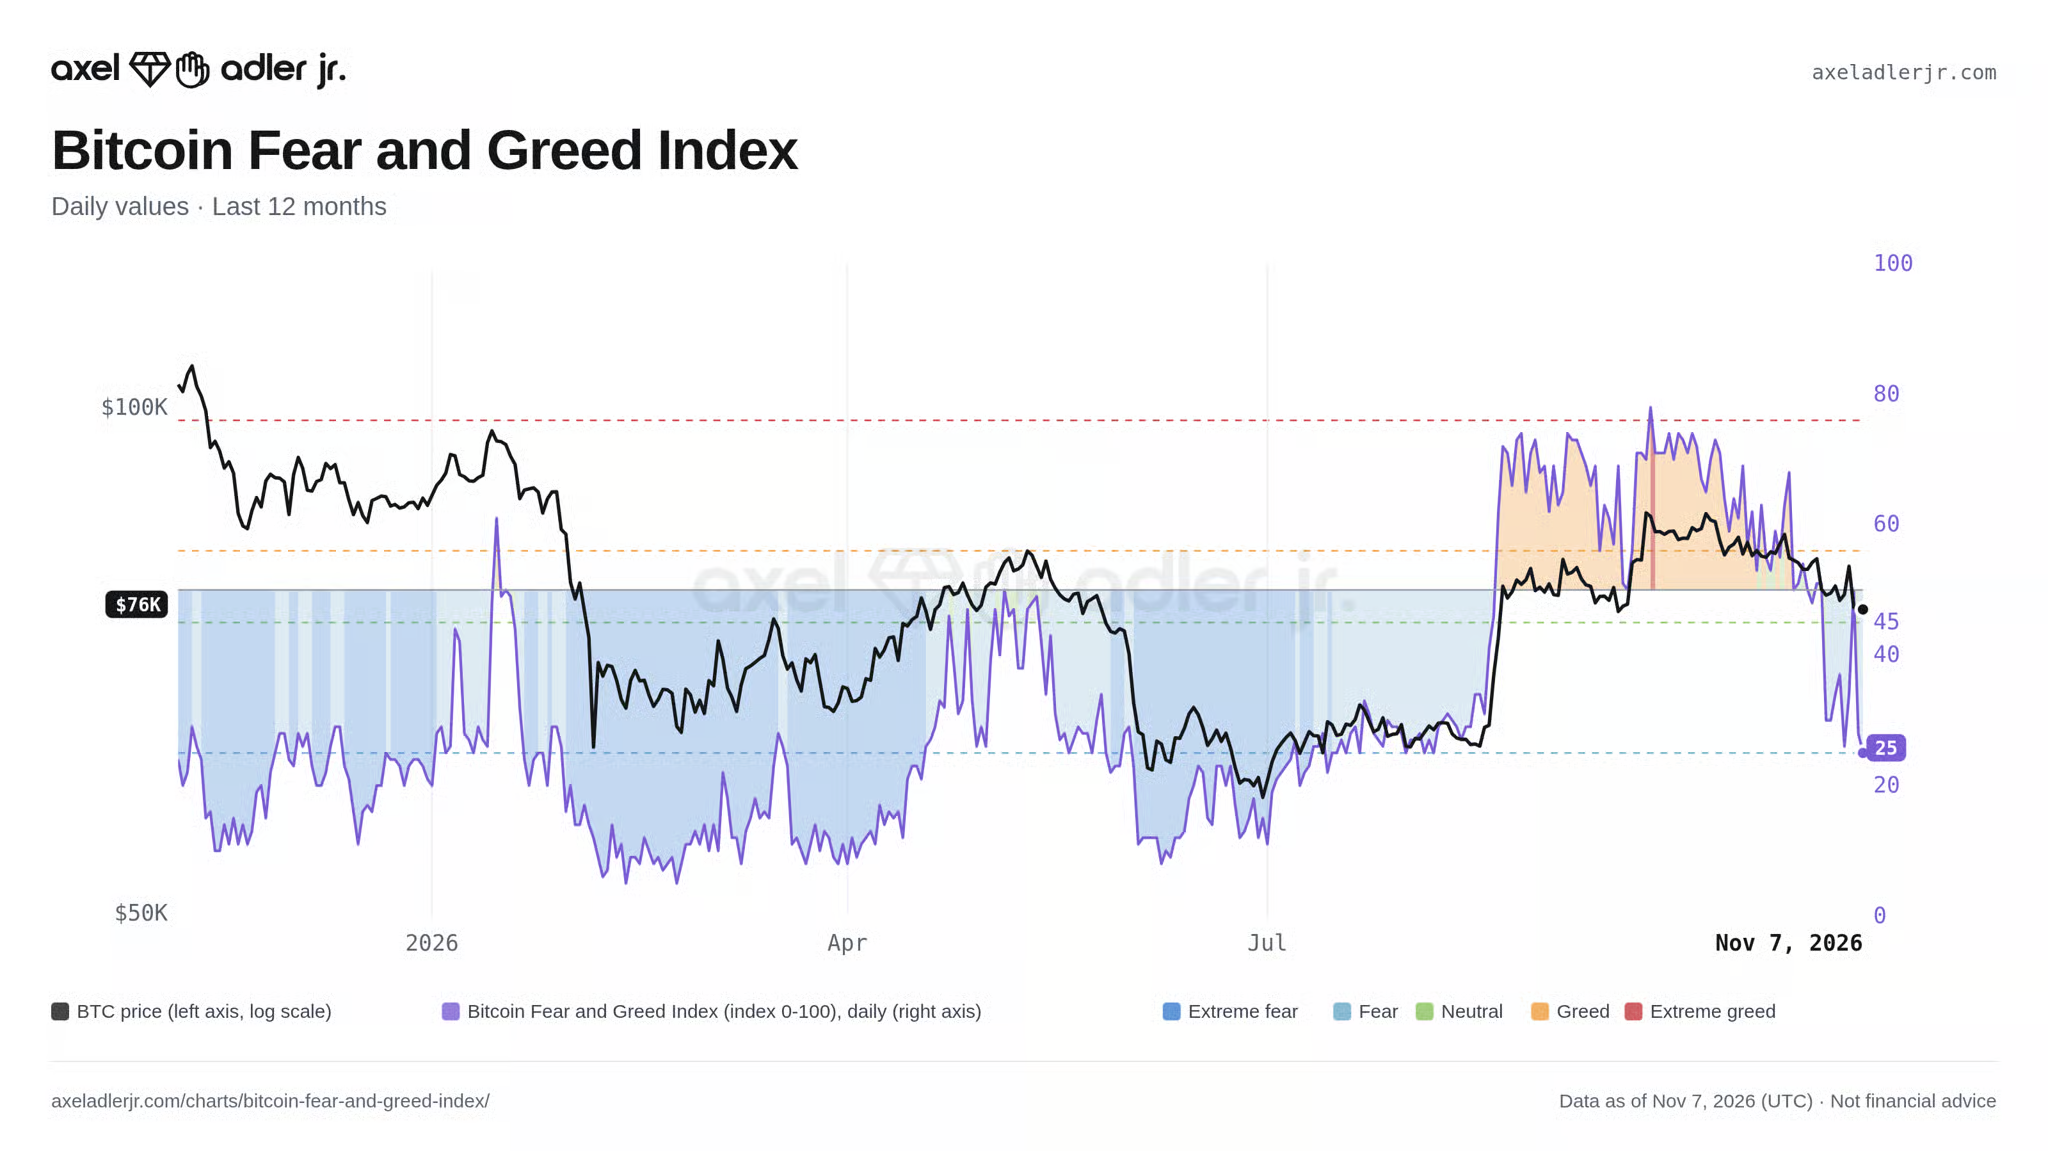
Fear is also clearly visible in the Fear and Greed Index.
On Thursday, the index plunged from 50 to 28 within just 24 hours. By Saturday, it had fallen further to 25, right on the threshold of extreme fear.
The reading recovered slightly to around 29 by Monday, but market sentiment remained weak.
Last Sunday, I pointed out that a reading of 30 represented ordinary fear and that sentiment could deteriorate further. And it did.
The chart shows that similar periods occurred in February and June this year, coinciding with local market bottoms.
What Is on This Week’s Economic Calendar?
The coming week will feature numerous speeches from Federal Reserve officials.
These could provide fresh insights into the monetary policy outlook. Following Friday’s employment report, their comments will be particularly interesting.
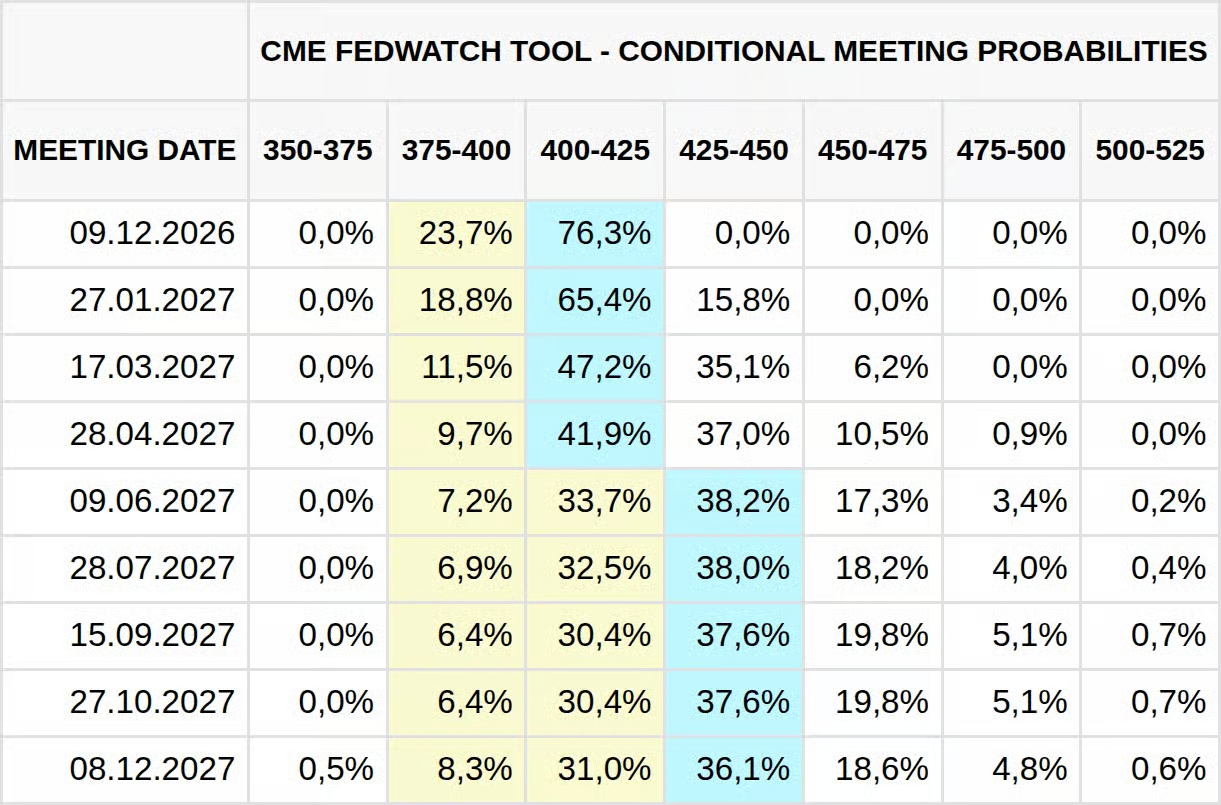
According to the CME FedWatch Tool, 76.3% of traders expected an interest rate hike in December at the end of last week.
Markets were also pricing in another increase in June 2027, implying two rate hikes in total.
On Thursday, however, traders had pushed expectations for the next policy move back to March.
This illustrates just how quickly expectations can change.
From a macroeconomic perspective, Tuesday will probably be the most important day.
At 2:30 p.m. Central European Time, the United States will release its October inflation figures.
In September, headline inflation accelerated to 3.7% year over year, while core inflation reached 2.6%.
If inflation surprises to the upside again, expectations for a December interest rate hike could strengthen further.
Wednesday is Veterans Day in the United States.
Banks and bond markets will be closed, but stock exchanges will remain open. Trading will therefore continue, although volumes are typically lower.
On Thursday at 4 p.m. Central European Time, we will receive fresh US housing market data.
Friday will bring the Producer Price Index (PPI) at 2:30 p.m.
The index surged by 1.3% in September, so investors will be particularly sensitive to the latest reading.
And then, of course, there are technology stocks.
Following Thursday’s crash, it will be important to see whether the Nasdaq stabilizes or whether the correction develops into something more serious.
Bitcoin has been moving almost in lockstep with technology equities over recent weeks.
Where Will Bitcoin Go Next?
Let me summarize the technical picture.
The hourly chart initially showed Bitcoin holding near $75,800, but Sunday’s decline broke that support and pushed the price toward $73,500.
The four-hour chart had been forming a bear flag. The latest sell-off supports the bearish interpretation, with a potential deeper target around $71,500.
The daily chart previously showed a bullish divergence above the support zone between $75,600 and $76,200. However, the loss of this area means the bullish scenario now requires fresh confirmation.
The weekly chart remains particularly interesting.
Bitcoin has closed below the 50WMA for the first time in several weeks, but the inverse Head and Shoulders pattern could still develop a right shoulder around $71,500.
The bullish scenario now begins with a recovery above $75,500–$75,600, allowing Bitcoin to reclaim both the 50WMA and the short-term holder cost basis.
A sustained move above $76,700 would further strengthen the outlook.
That could open the way for a move toward $78,700, followed by a test of the supply zone between $79,900 and $81,900.
The bearish scenario has gained strength following Sunday’s breakdown.
The first important area to watch is the recent low around $73,500.
Below that, the 200-day moving average near $73,200 could provide additional support.
A sustained breakdown below these levels would increase the likelihood of a move toward $72,200, where the average ETF acquisition price is located.
The next major target would be the potential right shoulder of the inverse Head and Shoulders pattern near $71,500.
Under particularly unfavorable macroeconomic conditions, an even deeper correction cannot be ruled out.
The supplementary indicators remain mixed.
Sellers appear exhausted, and market sentiment is approaching extreme fear. Historically, both conditions have favored the formation of a bottom.
On the other hand, weak demand, ETF outflows, and growing expectations of higher interest rates remain significant risks.
The latest breakdown below the 50WMA adds another bearish signal.
I would therefore be very cautious in the short term.
From a medium-term perspective, however, the market could still be developing an inverse Head and Shoulders pattern.
There is no rule stating that the right shoulder must fall to exactly the same level as the left shoulder.
Bitcoin could reverse higher before reaching $71,500 without necessarily invalidating the bullish pattern.
How Will I Trade Bitcoin?
That is an interesting question.
My analysis worked out quite well last week, and my derivatives portfolio has been performing nicely.
By the end of the week, however, I had closed all my positions.
At the time, Bitcoin was trading at a very strong support level around the 50WMA. The cost basis of short-term holders was located in the same area.
I expected this combination to create favorable conditions for a rebound.
The bullish divergence on the daily chart also supported the possibility of a recovery, although the four-hour chart pointed more toward further downside.
Personally, I attributed both Wednesday’s rally and Thursday’s sharp decline primarily to market emotions.
If Bitcoin were to reverse both moves, the overall weekly picture would not have changed much.
I was therefore prepared to disregard the bear flag and favor a bullish scenario.
My original plan was to distribute potential long entries between $75,150 and $73,500, with a stop-loss (SL) around $72,750 and a take-profit (TP) target near $80,000.
However, Sunday’s sell-off pushed Bitcoin directly into this planned entry zone.
The technical situation has therefore changed. The loss of the 50WMA and the lower support zone makes it important to reassess the setup rather than simply rely on the previous bullish expectation.
For a new long position, I would particularly want to see whether Bitcoin can stabilize above the recent low and begin reclaiming the lost support levels.
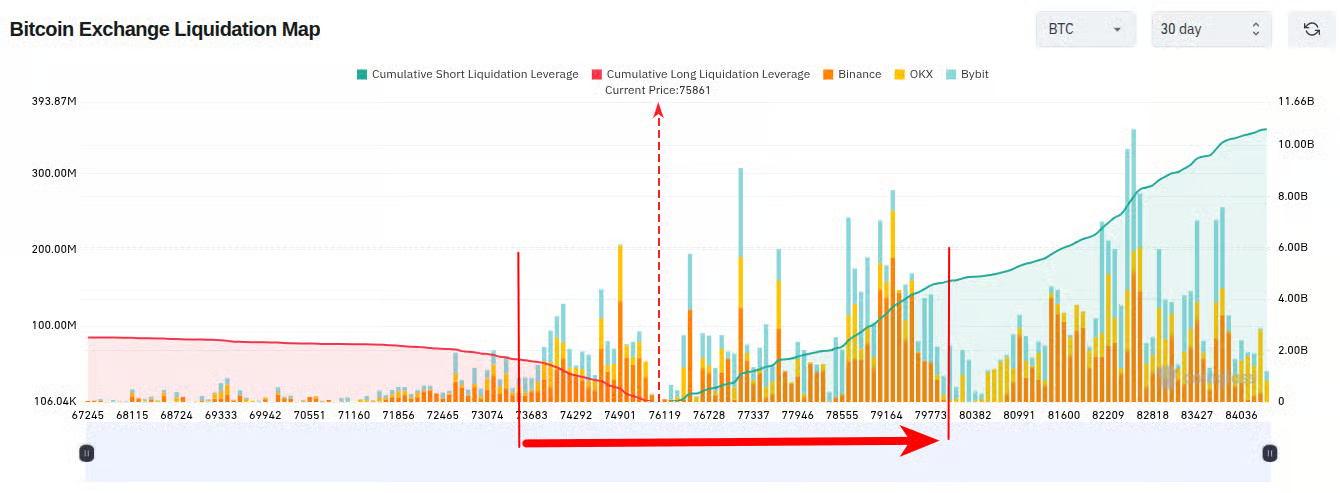
The monthly liquidity map of leveraged positions remains useful for identifying potential price targets, although it must also be interpreted alongside the latest market developments.
You can regularly follow my market observations on our Patreon and my profile on X.
However, these are only my personal opinions and trading decisions. They should not be interpreted as investment advice or recommendations.
Before making any investment, always conduct your own analysis, define your trading strategy, and follow it.
DYOR — Do Your Own Research.
