
Is Bitcoin Demand Recovering? Data Signals a Potential Price Bottom
Bitcoin’s price is stabilizing around $66,000 as indicators signal a potential bottom. Explore how decreasing selling pressure and shifting demand patterns could end the recent bearish trend and what it means for your portfolio.
The Bitcoin price experienced a volatile start to the week, dropping as low as $62,400 at Tuesday afternoon. However, market sentiment is shifting as key indicators signal a renewal of demand and a potential bottoming out of the current trend. Bitcoin is currently trading back around the $66,000 level, leading investors to wonder where the price is headed next.
Market Summary: Despite the recent dip, Bitcoin's recovery alongside traditional indices suggests that the worst of the selling pressure may be behind us.
The Correlation with Technology Stocks
A significant portion of this week’s downward pressure was driven by a sharp decline in technology stocks. IBM, for instance, witnessed one of its most challenging days in 25 years. This drop was sparked by news from Anthropic (the developer behind Claude AI) regarding the potential to automate legacy COBOL systems—traditionally one of IBM's most profitable business sectors.
Fortunately, the market tide turned quickly:
- Tuesday Bounce: Equities began to recover early Tuesday, pulling Bitcoin up with them.
- Nasdaq Mirroring: Short-term charts (15-minute intervals) show a high correlation between BTC and the Nasdaq Index.
- Index Composition: Since the Nasdaq contains the 100 largest non-financial companies—with tech firms making up 60%—Bitcoin is increasingly behaving like a sensitive tech asset.

Analyzing Bitcoin Volume Delta and Absorption
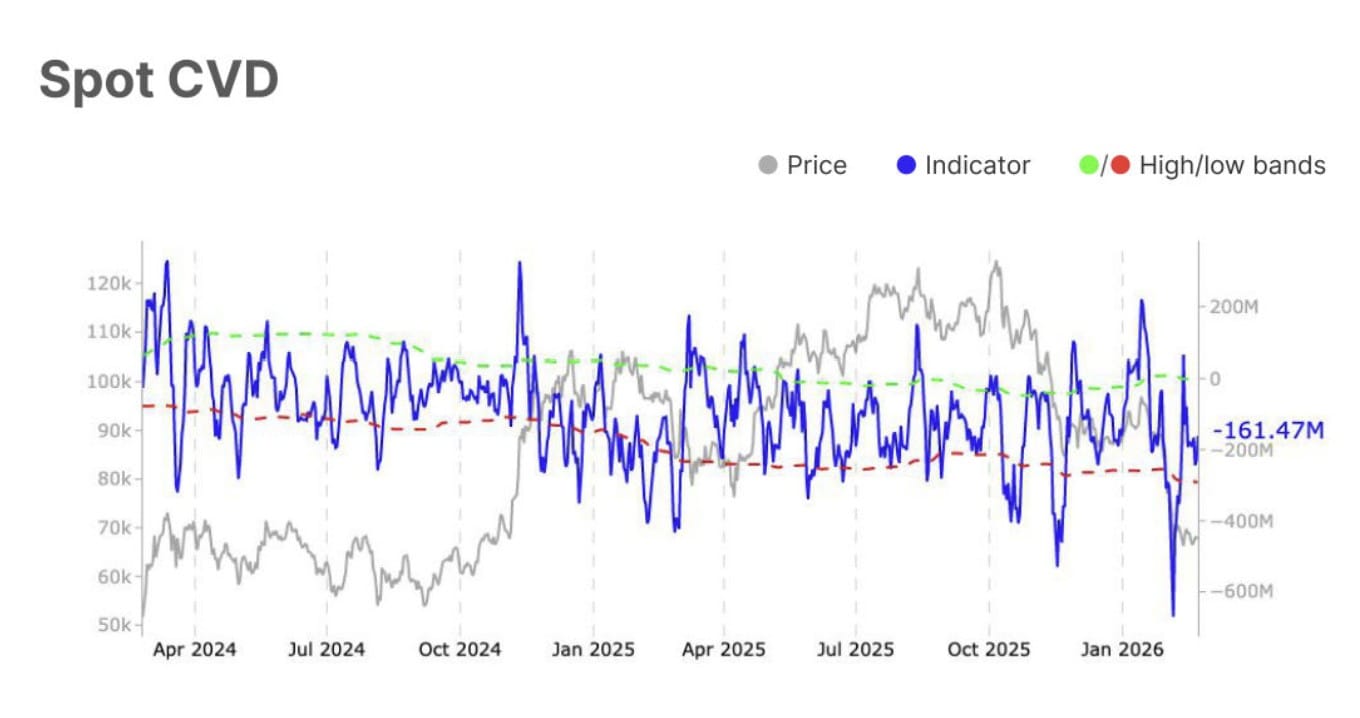
While Monday's drop was exacerbated by uncertainty surrounding new US tariffs, on-chain data suggests that aggressive selling is finally beginning to ease. The Bitcoin spot trade volume delta highlights a shift from heavy distributions to cautious absorption.
Improving Metrics
According to Glassnode data, the spot trade volume delta has improved from -$177.1 million to -$161.5 million. This narrowing of the deficit indicates that buyers are stepping in to meet the remaining sell orders.
The stabilization of the Cumulative Volume Delta (CVD) and its subsequent slight growth have historically coincided with the formation of a local price bottom.
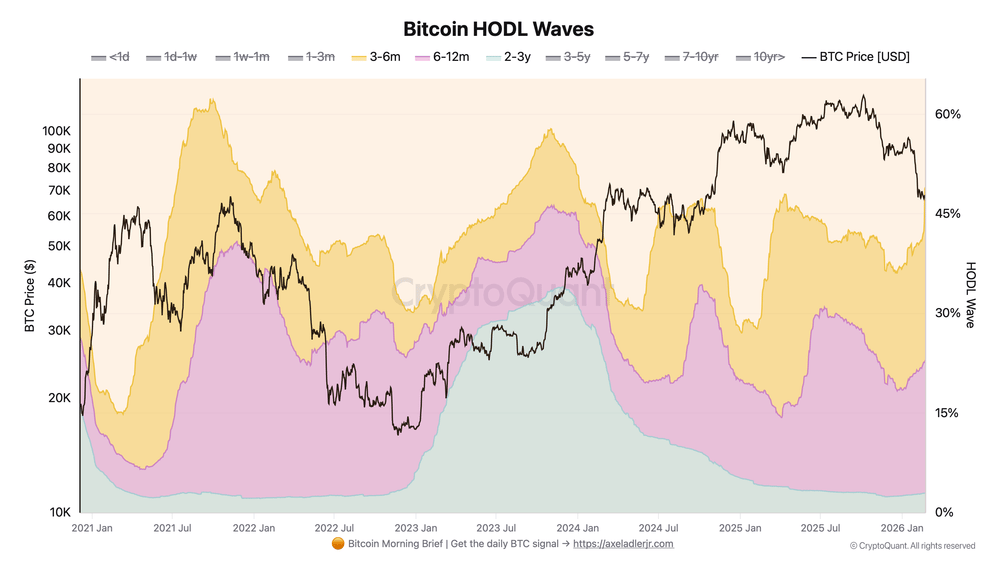
HODL Waves and Market Dynamics
The current market landscape reveals a mix of short-term pressure and long-term resilience. More than a quarter of the circulating supply consists of coins purchased between 3 to 6 months ago—right around the recent price peaks. While these holders may be under pressure, there is a silver lining: the number of coins held for longer periods is steadily increasing.
Caution: No single indicator is infallible. The market maintains a defensive stance, which may result in sideways movement for several months.
Future Outlook: Is $60,000 the Bottom?
The slight uptick in demand offers a glimmer of hope that the $60,000 level may indeed serve as the floor for the current bearish cycle. While high-impact news and stock market volatility continue to play a role, the gradual increase in accumulation by long-term holders is a positive fundamental sign.
Register on the TOP crypto exchange Bybit EU through this link and get 50 USDC!
FAQ
Frequently Asked Questions
Why did Bitcoin fall to $62,400?▼
What is the significance of the Spot CVD?▼
Crypto, Web3, and technology enthusiast. My portfolio includes cryptocurrencies, stocks, precious metals, crypto derivatives, and NFTs. I primarily make decisions based on technical analysis while considering macroeconomic indicators.