
Bitcoin Price Forecast: Will BTC Start a New Bull Run Within 12 Months?
Technical analysis suggests Bitcoin is mirroring its 2022 bear patterns. While a drop to $52,000 or even $40,000 seems likely in the short term, historical cycles point toward a potential trend reversal. Discover if a new bull run is on the horizon within the next 12 months.
The Cyclic Nature of Bitcoin: Why History Tends to Rhyme
Certain patterns of price behavior repeat over and over again in financial markets, and Bitcoin is no exception. Although an impression of complete unpredictability is often created around the leading cryptocurrency, its price development carries structural elements that return time and again. It is precisely the repetition of these schemes that allows for the observation of relatively readable development phases, even within the volatile Bitcoin market.
Once a market trend is clearly established to the downside, every moderate BTC price increase tends to be a short-term breather rather than a genuine reversal. In a bear market environment, smaller price rallies often do not represent the start of a new bull trend, but merely a temporary pause before a further decline continues.
Current market behavior mirrors the patterns seen in 2022, where bear flags were repeatedly formed throughout the downtrend until the market found a firm floor—which eventually proved to be around the 16,000 USD mark.
This cycle will likely be no different. A new bull trend cannot begin without the market establishing a new firm point of support. The market will continue to seek lower levels until selling pressure is exhausted and a stable balance between supply and demand begins to emerge. Establishing this long-term market equilibrium is a key milestone in the recovery process.
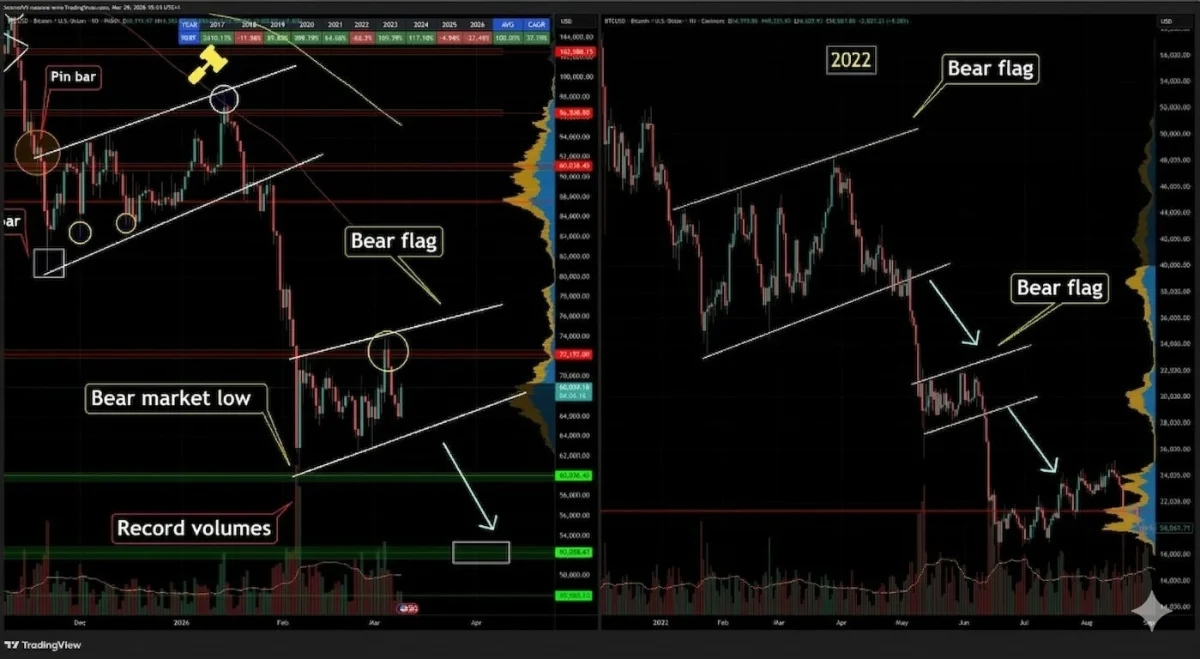
Bitcoin Trapped in a Medium-Term Descending Channel
Currently, Bitcoin is moving within a medium-term price structure characterized by a descending trajectory. If the market continues to respect the boundaries of this technical pattern, it is highly probable that the BTC price will reach the 52,000 USD level in the foreseeable future.
From a technical standpoint, the primary scenario remains bearish. The price action observed so far does not offer sufficient evidence to justify a significant change in market direction. This process is expected to unfold over weeks rather than days.
The Mechanics of the Bear Flag
Assuming the bear flag continues to develop, the price of Bitcoin may rise slightly or move sideways for a specific period. However, such a move should not be mistaken for a trend reversal. Instead, it represents a continuation of the current structure, offering only temporary strength before the next impulsive move to the downside.
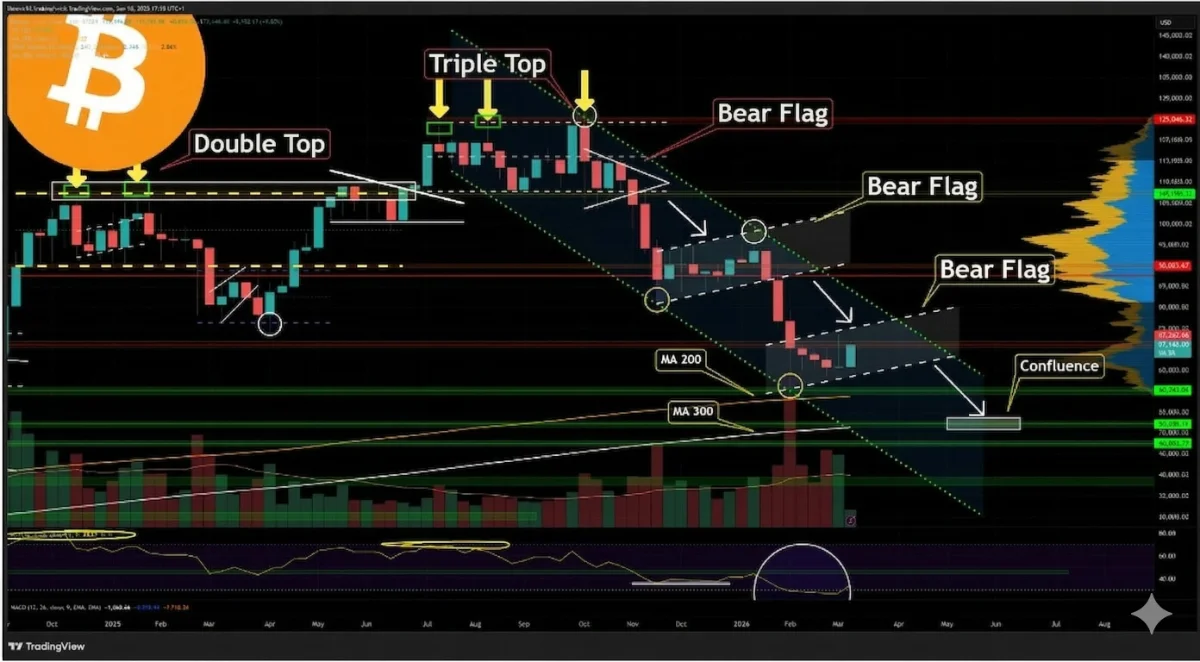
The 52,000 USD region serves as a crucial area of interest. A relatively strong support confluence is situated within this band, which could play a vital role in decelerating the decline. Breaking below this level may prove difficult due to significant buyer interest clustered in this zone.
Key Indicators to Watch
- 200-Week Moving Average: This moving average is a critical long-term orientation point for identifying a price bottom.
- Potential Undershoot: While 52,000 USD is major support, markets often "undershoot" targets during capitulation. This makes prices around 40,000 USD likely in the eyes of many analysts.
A drop below the 200-week moving average would be a significant milestone, suggesting the market has entered a deeper phase of the corrective cycle.
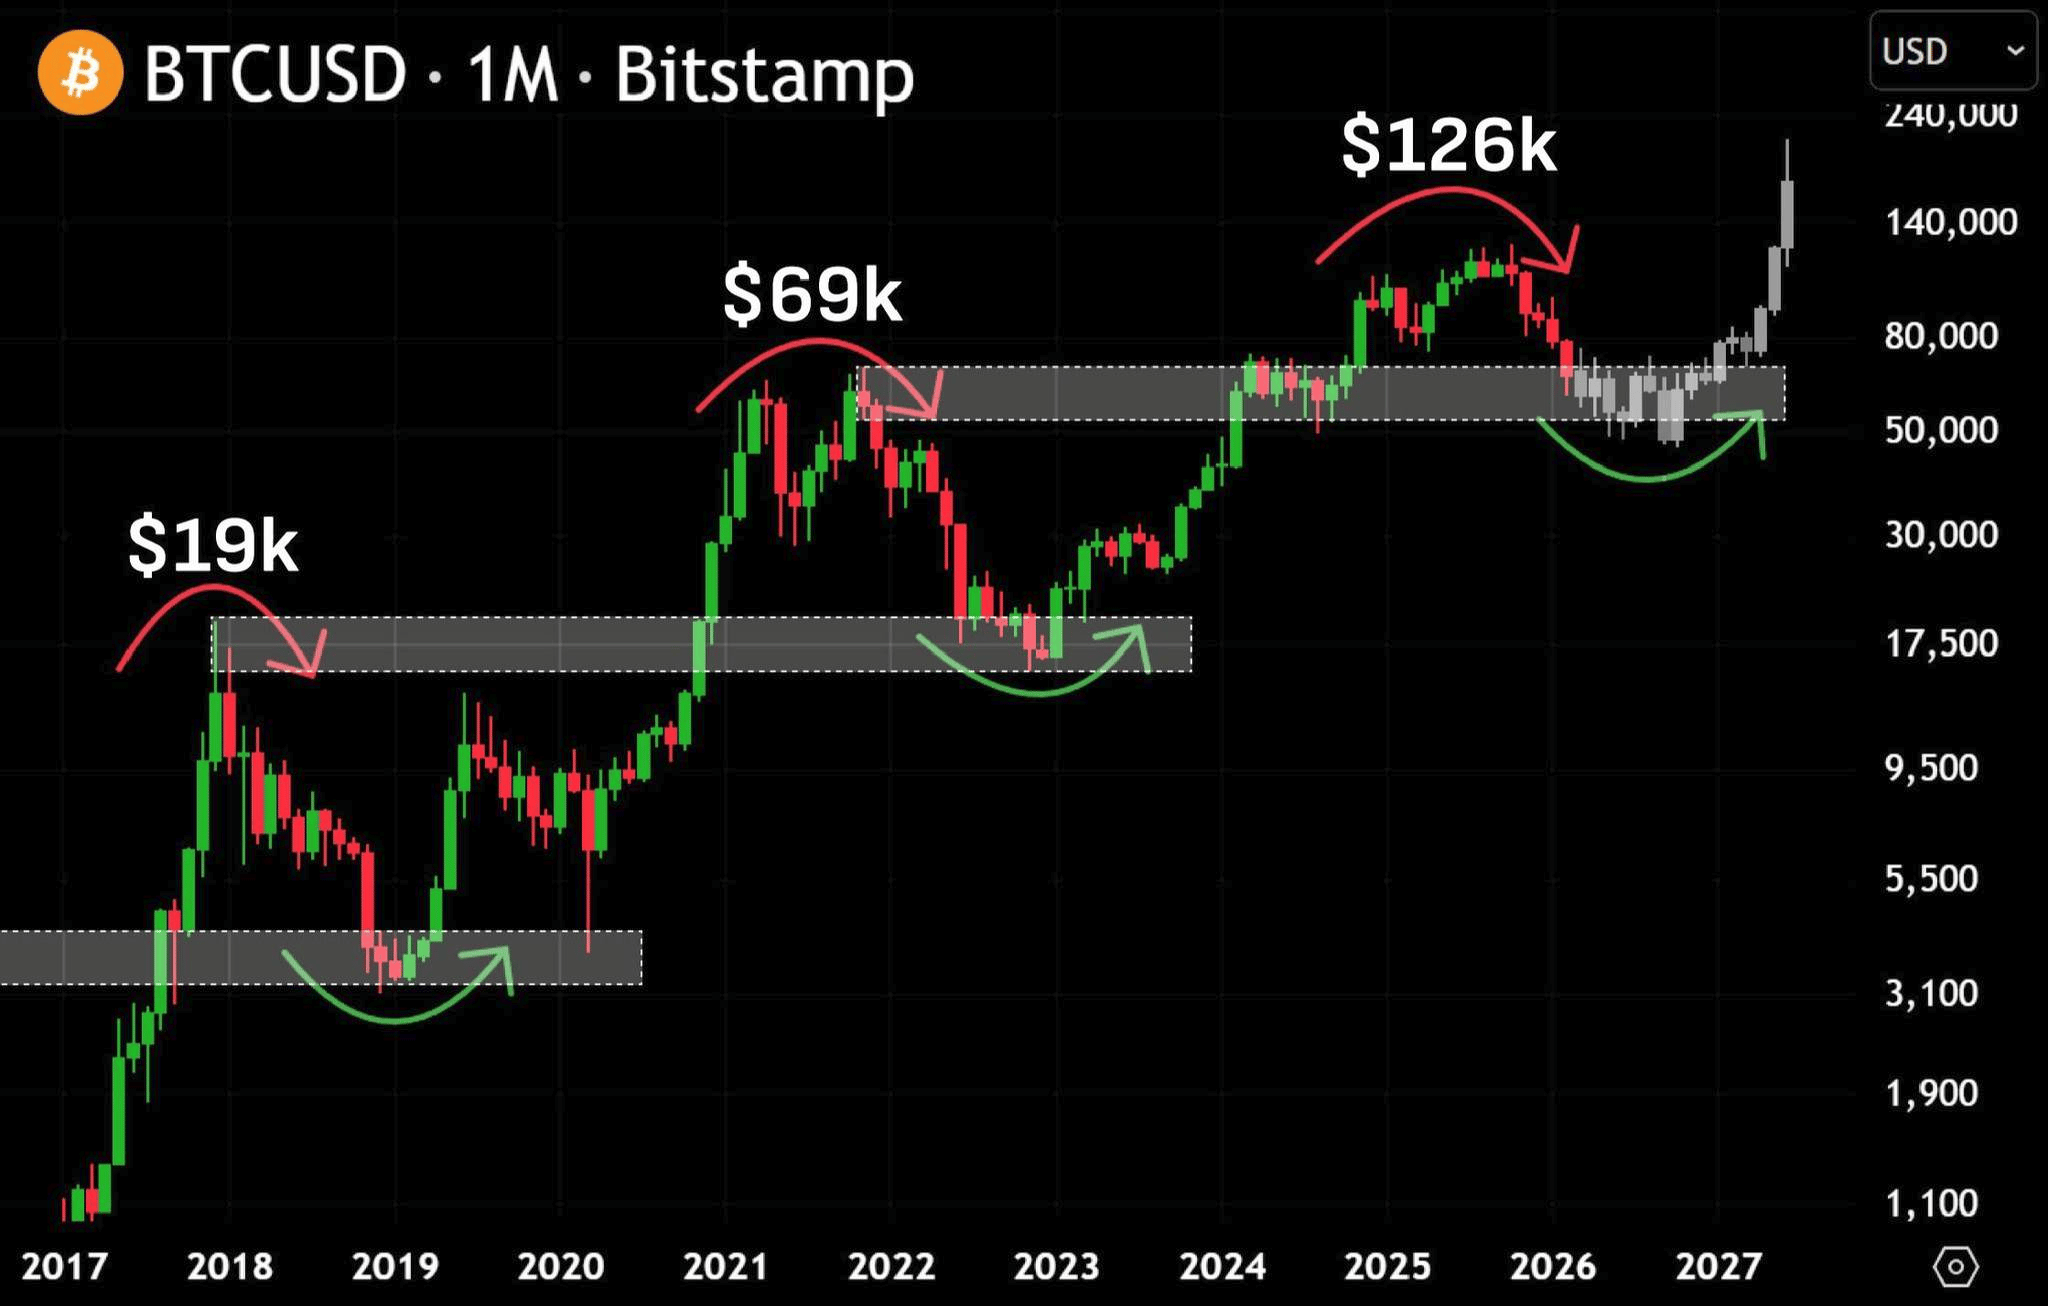
History Rhymes: When Will the New Bull Trend Begin?
Bitcoin's current price development is largely adhering to schemes observed in the previous two market cycles. While history does not repeat itself exactly, it certainly rhymes. This is particularly evident during significant bear trends where the market returns to established psychological and structural models.
"The BTC price has fallen by approximately 53% from its cyclical maximum. While significant, historical context shows that Bitcoin is capable of much deeper corrections during bear markets."
Because previous corrections have often been more severe, many believe further downside is still ahead of us. Currently, market sentiment regarding the ultimate bottom is divided:
- Moderate Bulls: Expecting a bottom around 50,000 USD.
- Structural Bears: Targeting the 35,000 USD mark.
- Extreme Pessimists: Anticipating even deeper declines.
The coming months will be absolutely crucial for Bitcoin. Over the next half-year, it will become clear which of these scenarios plays out. However, traders should remain humble; the market has a history of surprising the majority. While few expect it today, a "black swan" scenario could even see the price testing extreme lows, such as 3,000 USD, reminding investors that in the world of crypto, nothing is guaranteed.
Frequently Asked Questions
Is Bitcoin currently in a bear market?▼
Editor-in-chief, a graduate economist who found a passion for theoretical and investment economics. I also specialize in technical and fundamental analysis. On the website, I am mainly responsible for creating analyses, educational content, assigning tasks, and publishing news. Almost everything that appears on Kryptomagazin passes through my hands. Above all, I strive to educate our readers in key investment areas.