



Bitcoin experienced a week of sharp contrasts. After climbing to $84,867 on Wednesday, rising oil prices and a sell-off in technology stocks sent the cryptocurrency back into retreat. By Saturday, Bitcoin had briefly fallen below $80,000. With the Federal Reserve’s next policy decision approaching on Wednesday, it is time to reassess the technical picture, identify the most important support and resistance levels, and consider where Bitcoin might be heading next.
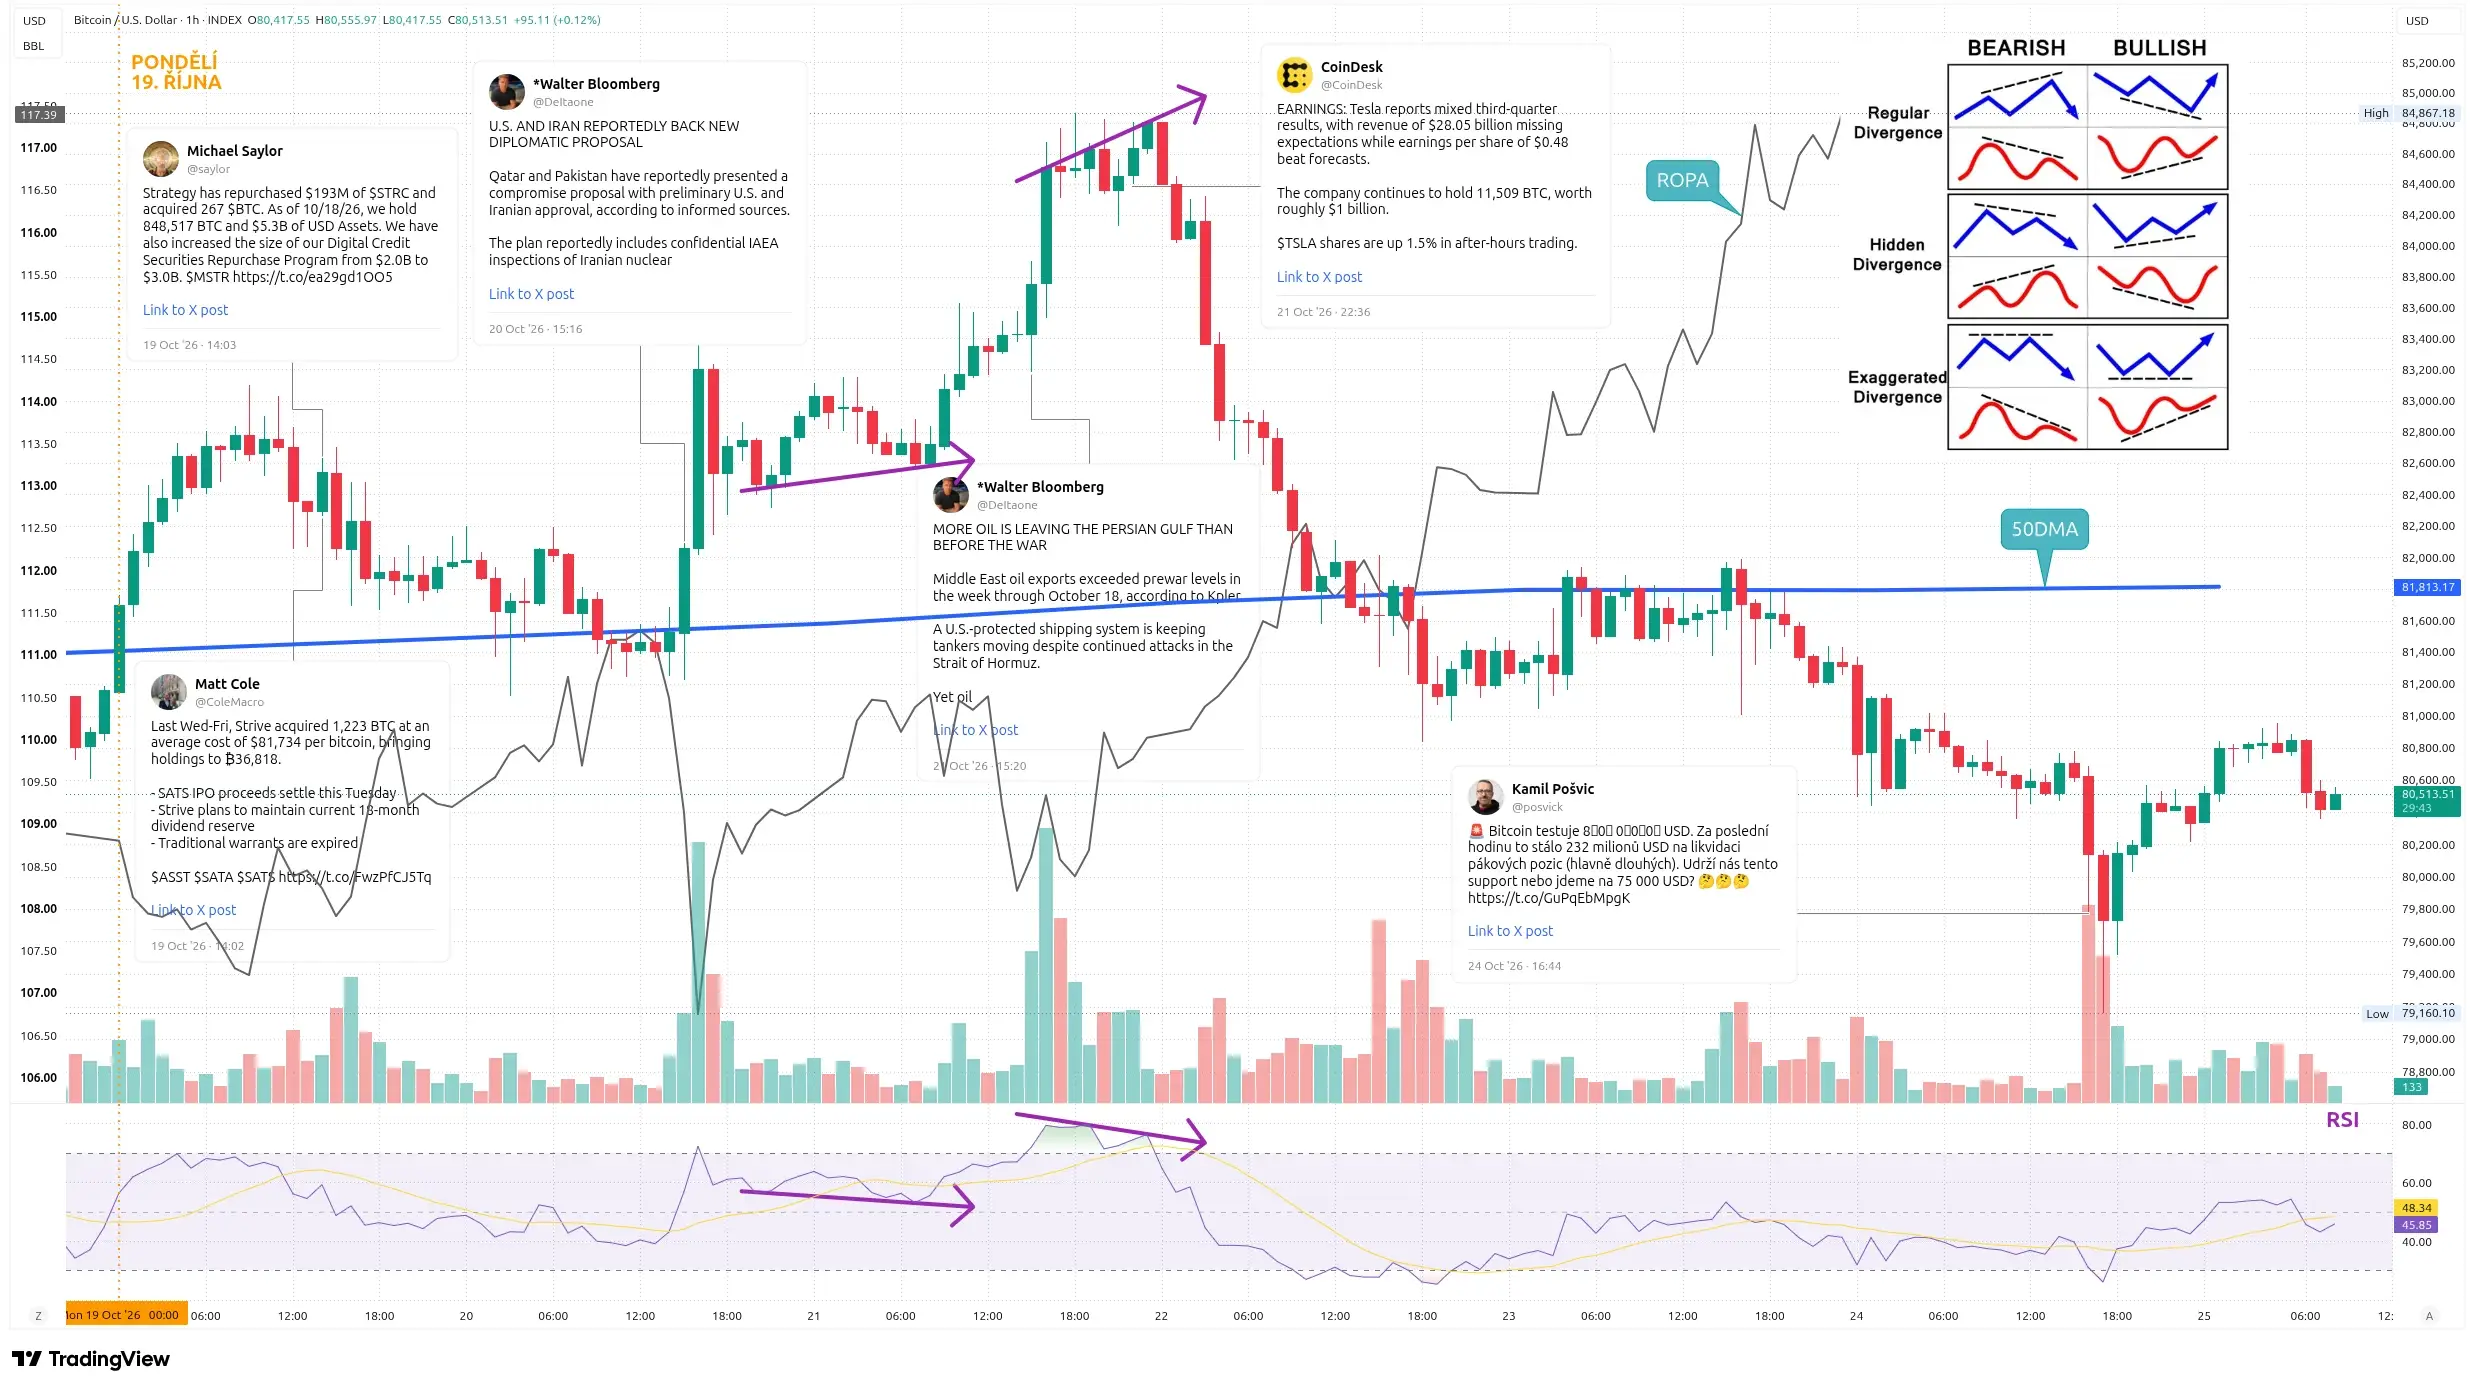
As usual, let’s begin with a recap of the past week. In last Sunday’s analysis, I suggested that Bitcoin could experience a short squeeze before returning to test the $80,000 level. That scenario played out almost exactly as anticipated. On Wednesday evening, Bitcoin reached $84,867, sweeping the cluster of short-position liquidity around $84,500. By Saturday afternoon, the market had established a weekly low of $79,160.
The week began with Bitcoin trading near $81,000 before advancing toward $83,000. Shortly after 2 p.m., Michael Saylor delivered another update. Strategy had purchased an additional 267 BTC, bringing its total holdings to a record 848,517 BTC. The company also repurchased approximately $193 million worth of its STRC preferred shares, expanded its buyback authorization from $2 billion to $3 billion, and reported $5.3 billion in cash reserves.
Strive also disclosed additional Bitcoin purchases around the same time. We discussed the company’s activity during Wednesday’s livestream. Between Wednesday and Friday, Strive acquired 1,223 BTC at an average price of $81,734, bringing its holdings to 36,818 BTC. Including purchases made on Monday and Tuesday, its total acquisitions for the week reached 4,045 BTC.
Despite these seemingly bullish developments, Bitcoin once again responded by moving lower. By the evening, the price had slipped back to approximately $81,800.
Spot Bitcoin ETFs Record Their Strongest Day Since September
Monday also brought some interesting developments in the spot Bitcoin exchange-traded fund (ETF) market. The funds recorded combined net inflows of $526.7 million.
At first glance, this might suggest renewed institutional appetite for Bitcoin. However, the inflows were driven almost entirely by BlackRock’s IBIT, while overall trading volumes remained close to their historical average.
For that reason, I would interpret the activity as a particularly large transaction rather than convincing evidence of a sustained recovery in institutional demand.
On Tuesday afternoon, reports emerged that the United States and Iran were supporting a new diplomatic proposal put forward by Qatar and Pakistan. The initiative reportedly included inspections of Iranian nuclear facilities by the International Atomic Energy Agency (IAEA).
Oil prices immediately declined, while Bitcoin surged above $83,000.
The optimism proved short-lived, however, as the initial reports turned out to be less accurate than suggested. That has become something of a recurring theme lately.
Nevertheless, the technical indicators were beginning to show a hidden bullish divergence. Bitcoin was forming higher lows while the Relative Strength Index (RSI) was making lower lows. This typically signals a continuation of the prevailing upward trend, which is precisely what followed.
Strong results from SpaceX also helped revive enthusiasm for technology stocks. The Nasdaq gained 1.1% on Wednesday, while spot Bitcoin ETFs attracted another $525 million in net inflows. Unlike Monday, the gains were broadly distributed across the funds.
We examined these developments in detail during Wednesday evening’s livestream. Before midnight, Bitcoin reached its weekly high of $84,867.
At that point, however, a classic bearish divergence emerged. The price recorded a higher high while the RSI made a lower high.
Following the close of US markets, Tesla released its quarterly earnings. Revenue of $28.05 billion fell short of expectations, although earnings per share of $0.48 exceeded forecasts. Incidentally, Tesla continues to hold 11,509 BTC.
Surging Oil Prices Wipe Out Gains Across Financial Markets
Tesla’s mixed earnings results indirectly reignited concerns about the returns on massive investments in artificial intelligence. Asian markets declined overnight, and Bitcoin lost approximately $1,600 within a single hour.
Thursday brought another negative development. According to The New York Times, the US and Israeli militaries had reportedly prepared plans to resume strikes against Iran following the November elections.
Reports of Houthi attacks in Saudi Arabia added further pressure. Brent crude jumped 4% to $113.17 per barrel, its highest level in five months.
Interestingly, Walter Bloomberg had cited Kpler data on Wednesday suggesting that oil shipments from the Persian Gulf were actually exceeding pre-war levels. But markets were reacting to geopolitical fears rather than the physical supply of crude.
Nvidia shares fell 4.4%, while Meta lost 7%. Bitcoin declined toward $81,000, with its RSI entering oversold territory near 27.
Nearly $418 million in leveraged long positions were liquidated. Meanwhile, spot Bitcoin ETFs recorded outflows of $635.6 million, completely reversing Wednesday’s inflows.
By Friday, the market had clearly entered a wait-and-see phase.
Bitcoin traded sideways around its 50-day moving average (50DMA). Several attempts to break above the indicator were rejected.
Oil prices continued climbing, approaching $117 per barrel by the evening, while the yield on 10-year US Treasury bonds returned to 5%.
Spot Bitcoin ETFs suffered another $137.9 million in outflows on Friday. Despite the weakness, the funds still managed to finish the week with approximately $442 million in net inflows.
Saturday’s Sell-Off Sends Bitcoin Below $80,000
Anyone expecting a quiet weekend was quickly disappointed.
Selling pressure emerged overnight on Friday, pushing Bitcoin toward $80,600 by Saturday morning. What followed was a sharp liquidation-driven decline, amplified by the market’s characteristically thin weekend liquidity.
Around 4 p.m., a long squeeze accelerated the sell-off. Approximately $232 million in leveraged positions were liquidated within the first hour, while total liquidations for Saturday reached $547 million.
Trading volumes were also relatively substantial.
Bitcoin ultimately established its weekly low at $79,160, falling below $80,000 for the first time since October 15.
A rebound began later on Saturday evening. By Sunday morning, Bitcoin was trading near $80,500, with the hourly RSI recovering to approximately 46.
The 50-day moving average remains overhead at $81,813. The important question now is whether this previously supportive indicator has become resistance.
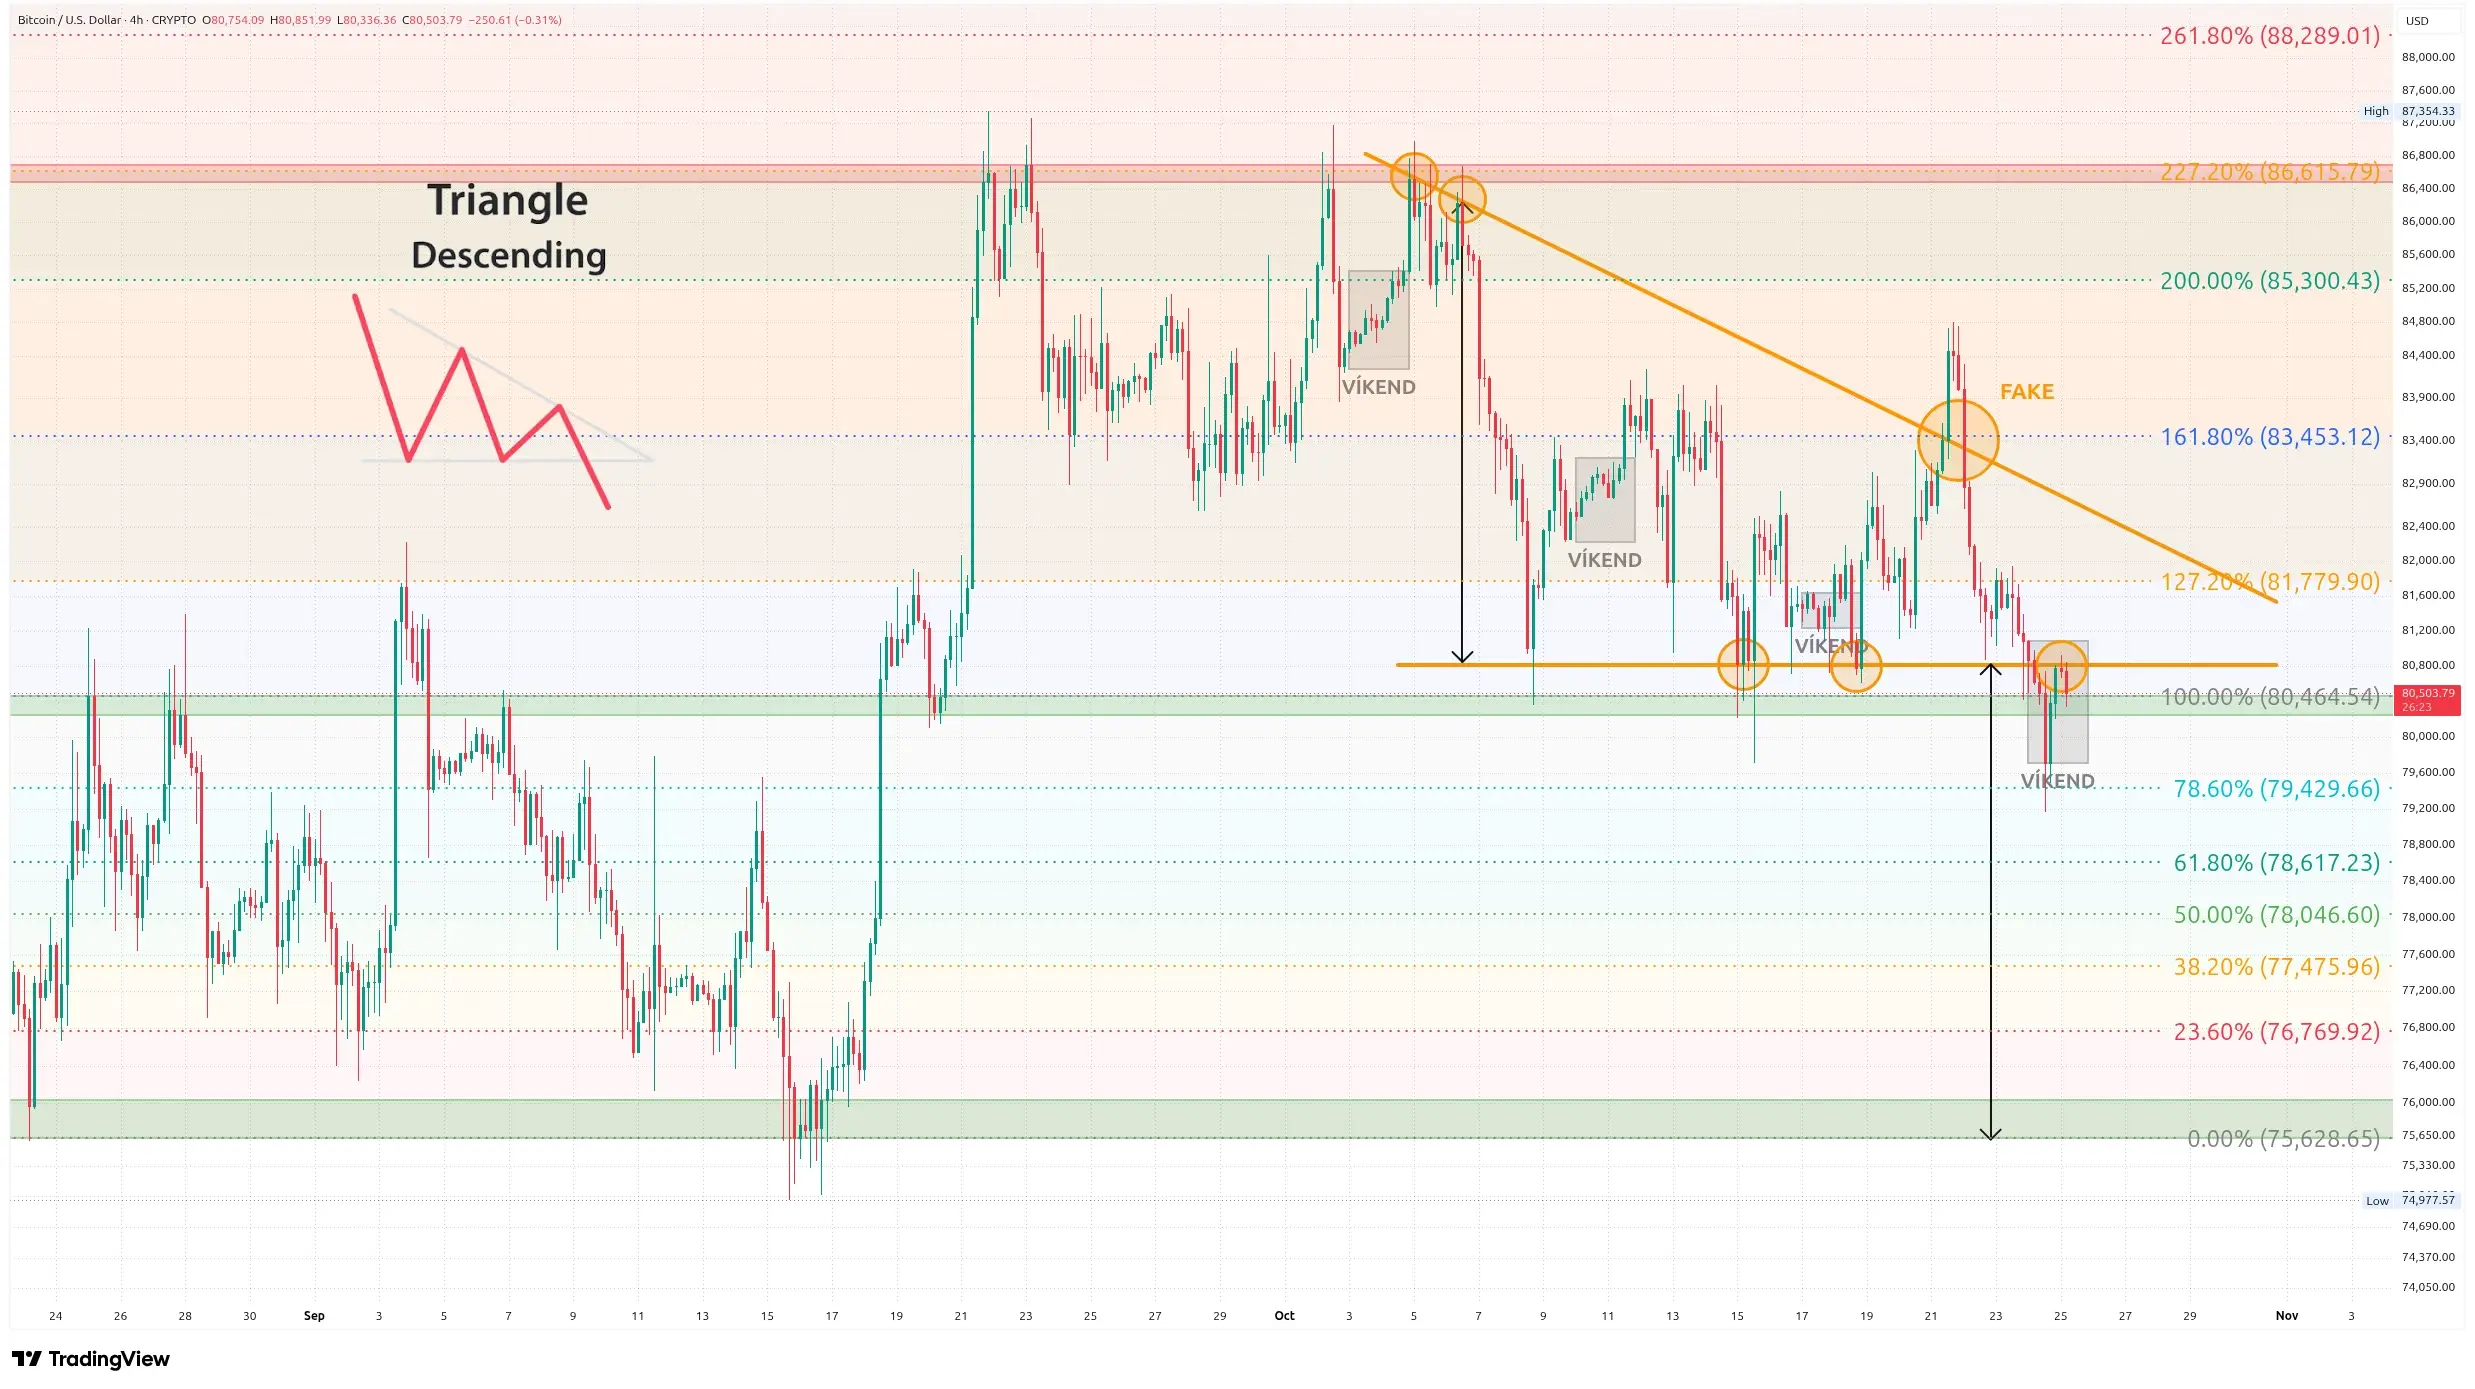
Four-Hour Chart Reveals a False Breakout From a Descending Triangle
In last week’s analysis, I highlighted a descending triangle formation on Bitcoin’s four-hour chart.
On Wednesday, the pattern appeared to be breaking to the upside. Candlesticks moved above the descending resistance line, with the price climbing toward $84,800.
Unfortunately for the bulls, the breakout proved false. By Thursday, Bitcoin had already fallen back inside the triangle.
We are now testing the pattern’s lower boundary near $80,750 for the third time. This level acted as support twice last week and is now being tested as potential resistance.
I have highlighted weekends in gray on the chart because these lower-liquidity trading periods repeatedly appear to bring Bitcoin back toward the same price levels.
Saturday’s candlestick closed below $80,750. The next step is to watch whether the market confirms this level as resistance. If Bitcoin moves back inside the triangle, I would also classify Saturday’s move as a false breakdown.
I have extended the Fibonacci retracement levels on the chart, and the alignment is surprisingly compelling.
The nearest support lies at $80,465, corresponding to the 100% Fibonacci level. Below that, another support appears around $79,430 at the 78.6% level.
Based on the triangle’s measured height, a full bearish breakdown would imply a move toward the green support zone around $75,630, corresponding to the 0% Fibonacci level.
Interestingly, this is the same support region that has appeared repeatedly in my analyses over the past several weeks.
On the upside, initial resistance stands at $81,780, corresponding to the 127.2% Fibonacci extension, followed by $83,450 at the 161.8% level.
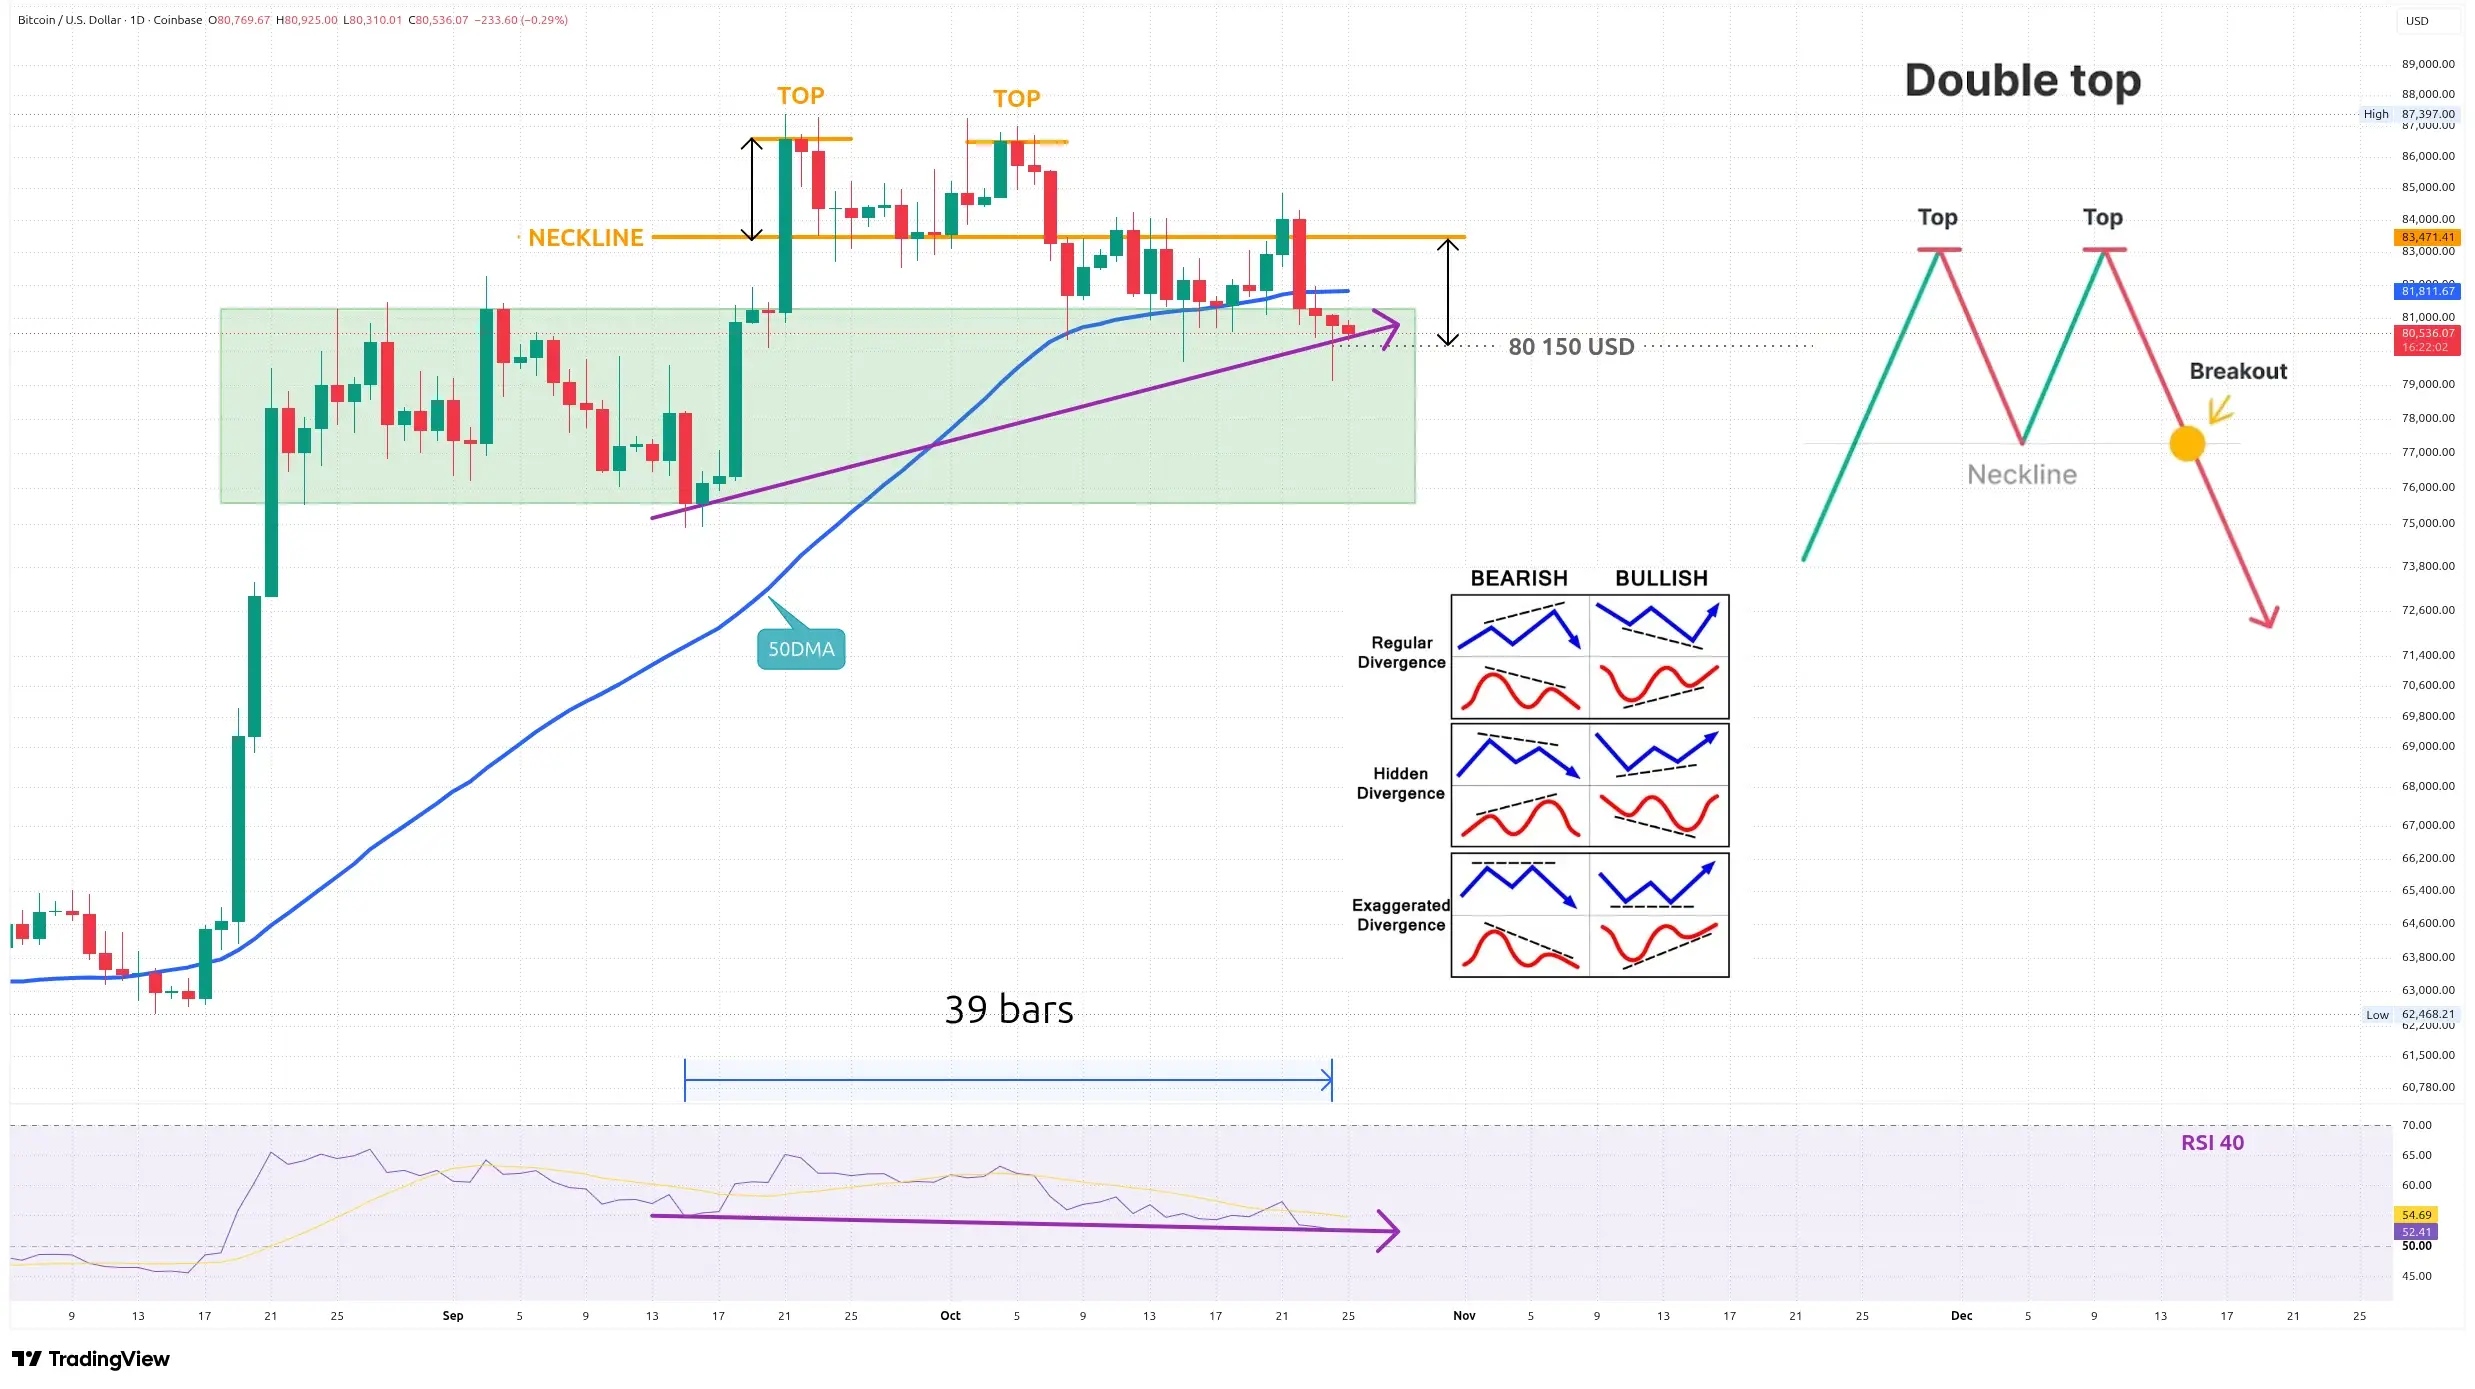
Daily Chart Approaches the Double-Top Price Target
In my previous analysis of the daily chart, I expected Bitcoin to retest the neckline of its double-top formation.
That happened on Wednesday, when the daily candlestick actually closed slightly above the neckline at $83,471.
However, given how marginal the breakout was, I continued to regard the level as valid resistance. Subsequent price action has reinforced that assessment.
Measuring the height of the double-top formation and projecting it below the neckline gives us a conventional downside target of approximately $80,150.
Bitcoin briefly reached that area on Saturday and remains relatively close to it.
We could therefore argue that the double-top pattern has already fulfilled its bearish target. Personally, though, I prefer to judge these formations by candlestick closing prices rather than brief intraday wicks.
The green support zone around $75,000, which Bitcoin visited in September and which I highlighted last week, would consequently represent an extended bearish target rather than the primary objective.
A more concerning development is that the last two daily candlesticks closed below the 50DMA, currently near $81,816.
This moving average had supported the market for two consecutive weeks. Now we need to establish whether it has turned into resistance.
Of course, weekend price action can occasionally produce misleading technical signals.
I have also added a longer-period RSI setting of 40 to the daily chart. This indicator reacts more slowly but is less vulnerable to short-term market noise.
What stands out is a hidden bullish divergence that has been developing for 39 days.
Since mid-September, Bitcoin has been forming higher price lows while the RSI has continued making lower lows.
Saturday’s candlestick also resembles a hammer, with a long lower wick and almost no upper shadow. Such a formation can indicate a potential reversal.
In other words, the double-top’s bearish target may already have been reached, while the hidden bullish divergence supports the possibility of renewed upward momentum.
For that scenario to gain credibility, however, Bitcoin needs to reclaim its 50-day moving average as soon as possible.
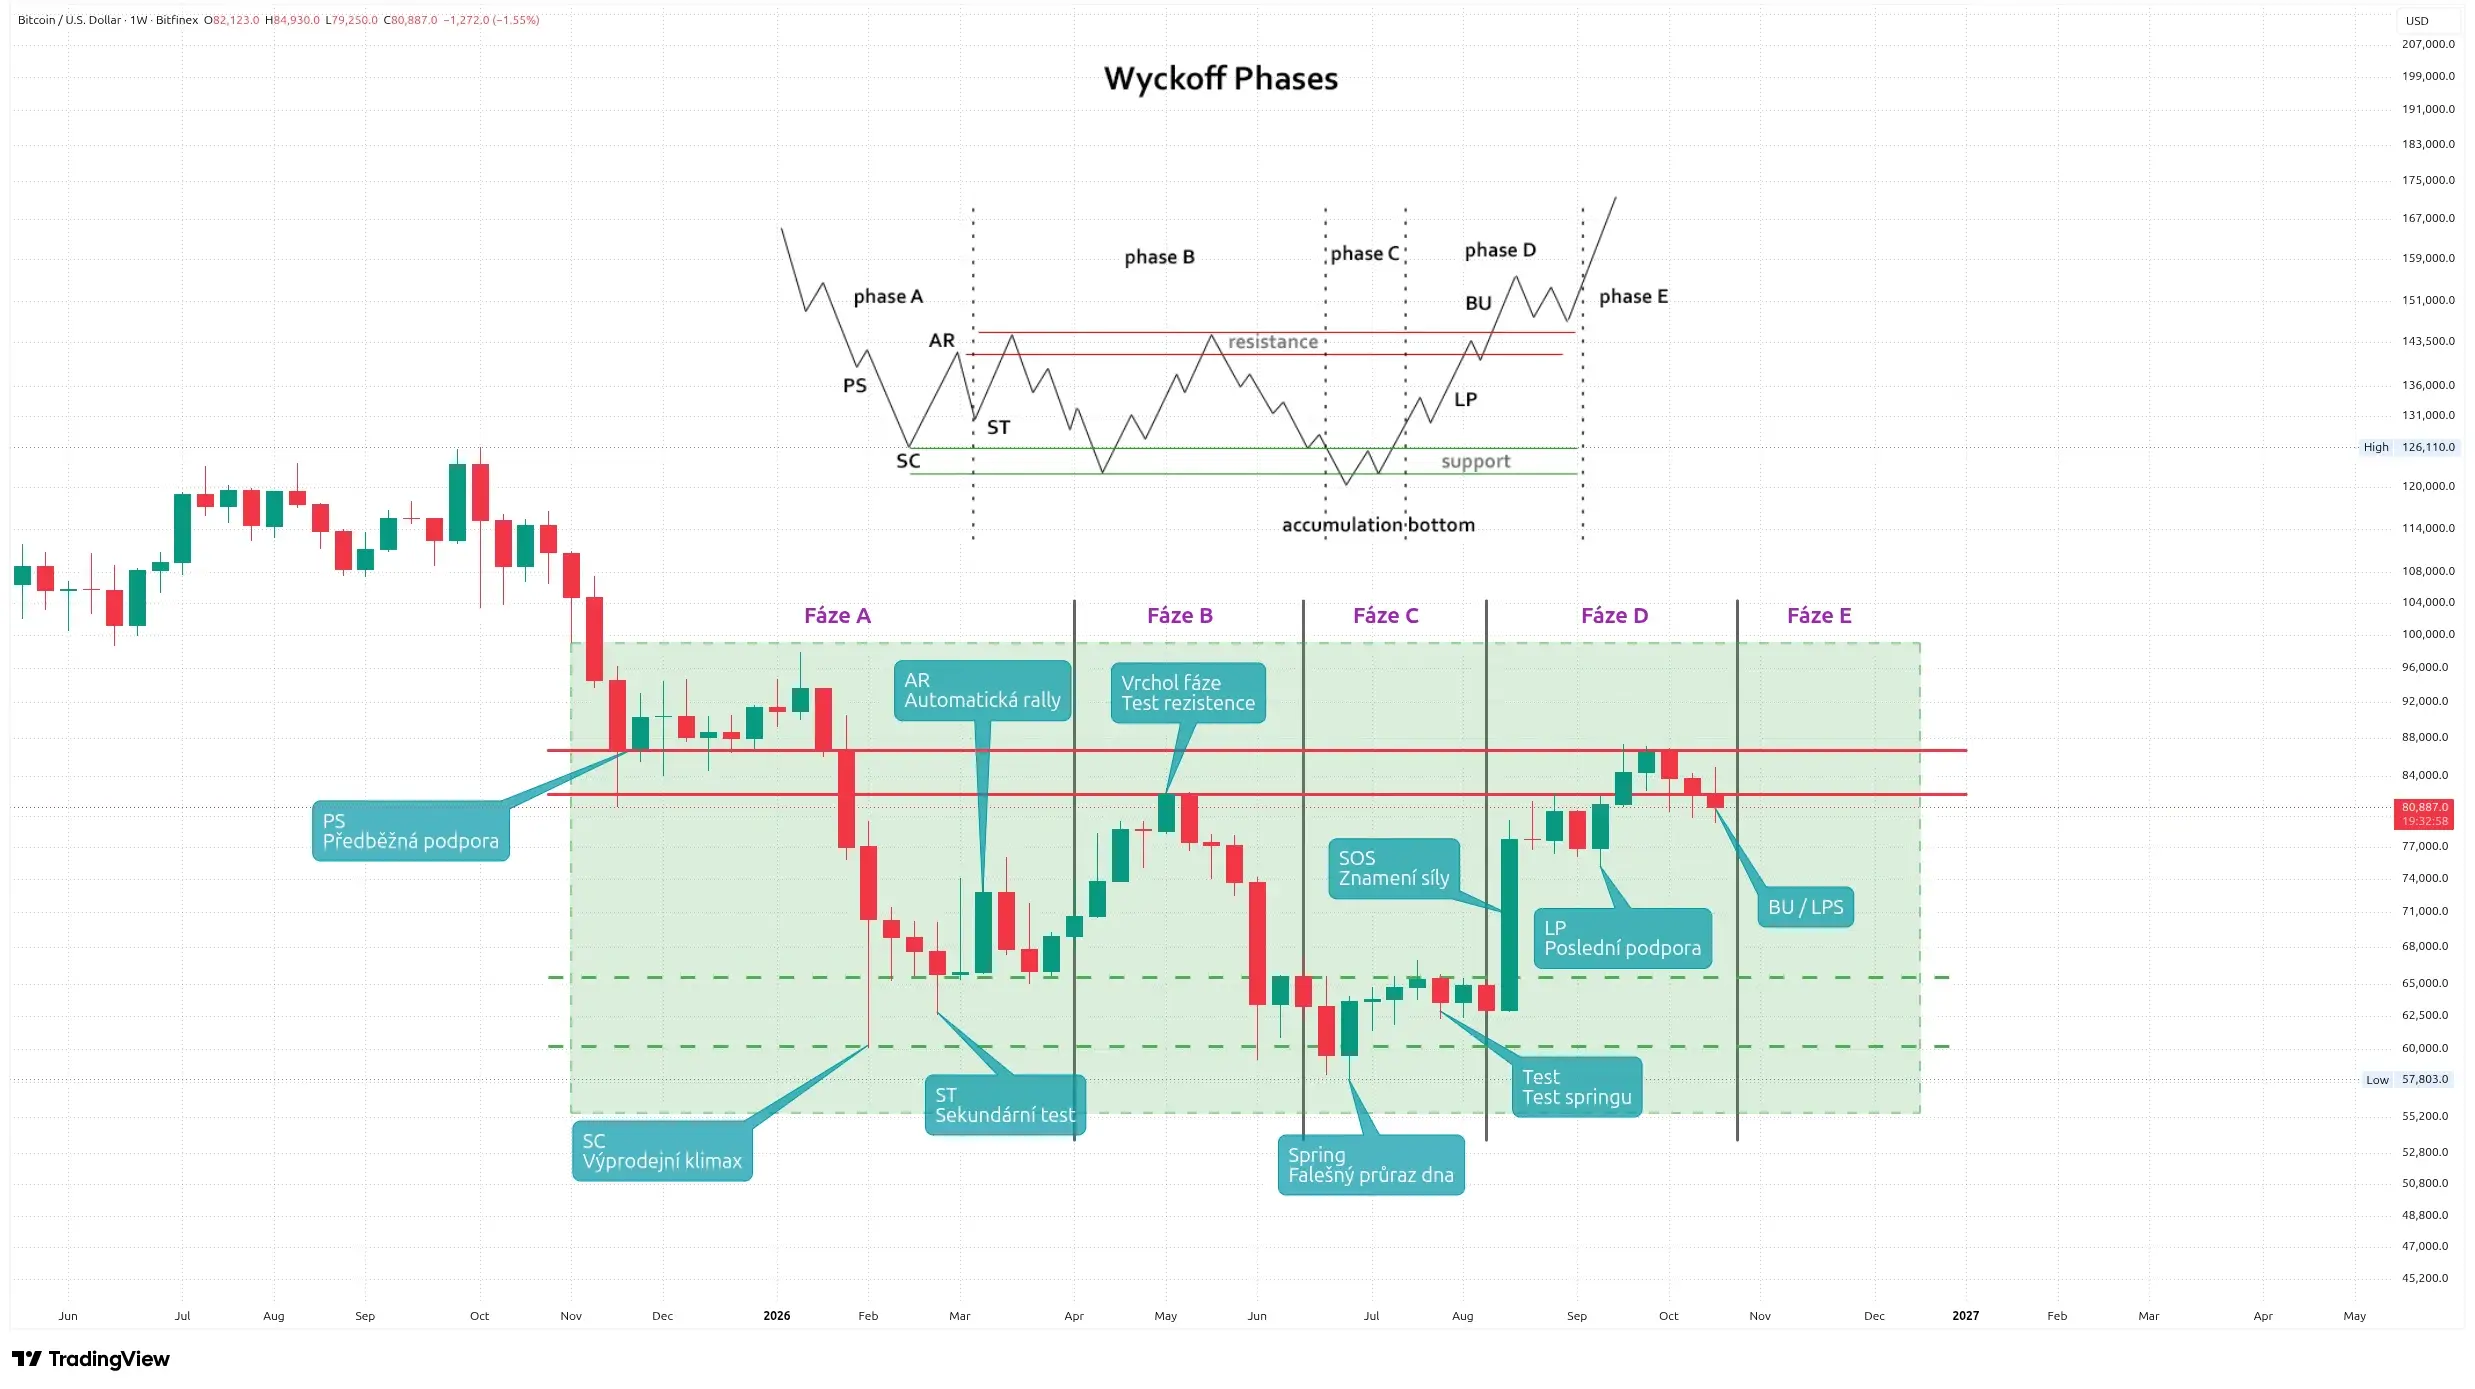
Weekly Chart Points to Wyckoff Accumulation
Last week, I focused on a potential inverse head-and-shoulders formation on Bitcoin’s weekly chart.
This time, I want to approach the market from a different perspective: the Wyckoff method.
The Wyckoff accumulation model describes how large market participants gradually accumulate an asset through five distinct phases before a sustained upward trend begins.
Looking at Bitcoin’s price action since November of last year, the resemblance is remarkably strong.
Phase A began with preliminary support (PS) in November, followed by a selling climax (SC) around $60,000 in February. An automatic rally (AR) and secondary test (ST) followed.
During Phase B, Bitcoin tested resistance near $82,000 in May.
Phase C was defined by a spring — a temporary breakdown below the trading range in June — followed by a successful test of that low in August.
A powerful bullish candlestick in mid-August represented a sign of strength (SOS).
September brought the last support point (LP), while Phase D pushed Bitcoin toward resistance around $87,000.
Under the Wyckoff framework, I would interpret the current correction as a back-up or last point of support (BU/LPS), effectively a retest of the upper boundary of the previous Phase B trading range.
That means May’s high near $81,700 should now act as support.
There is a great deal to unpack here, and I may dedicate a separate article to this particular market structure.
For now, Sunday’s weekly close will be especially important.
A close above $81,700 would keep the transition into Phase E on the table, potentially paving the way for a breakout above $87,000.
Conversely, a weekly close below $80,000 would suggest that the accumulation process may take longer to complete.
Such an outcome would also remain consistent with the inverse head-and-shoulders scenario discussed last week, where the right shoulder could form around $73,000.
What Are Bitcoin Derivatives Telling Us?
Derivatives continue to play a dominant role in Bitcoin’s price movements, which is why I pay particular attention to leveraged positioning.
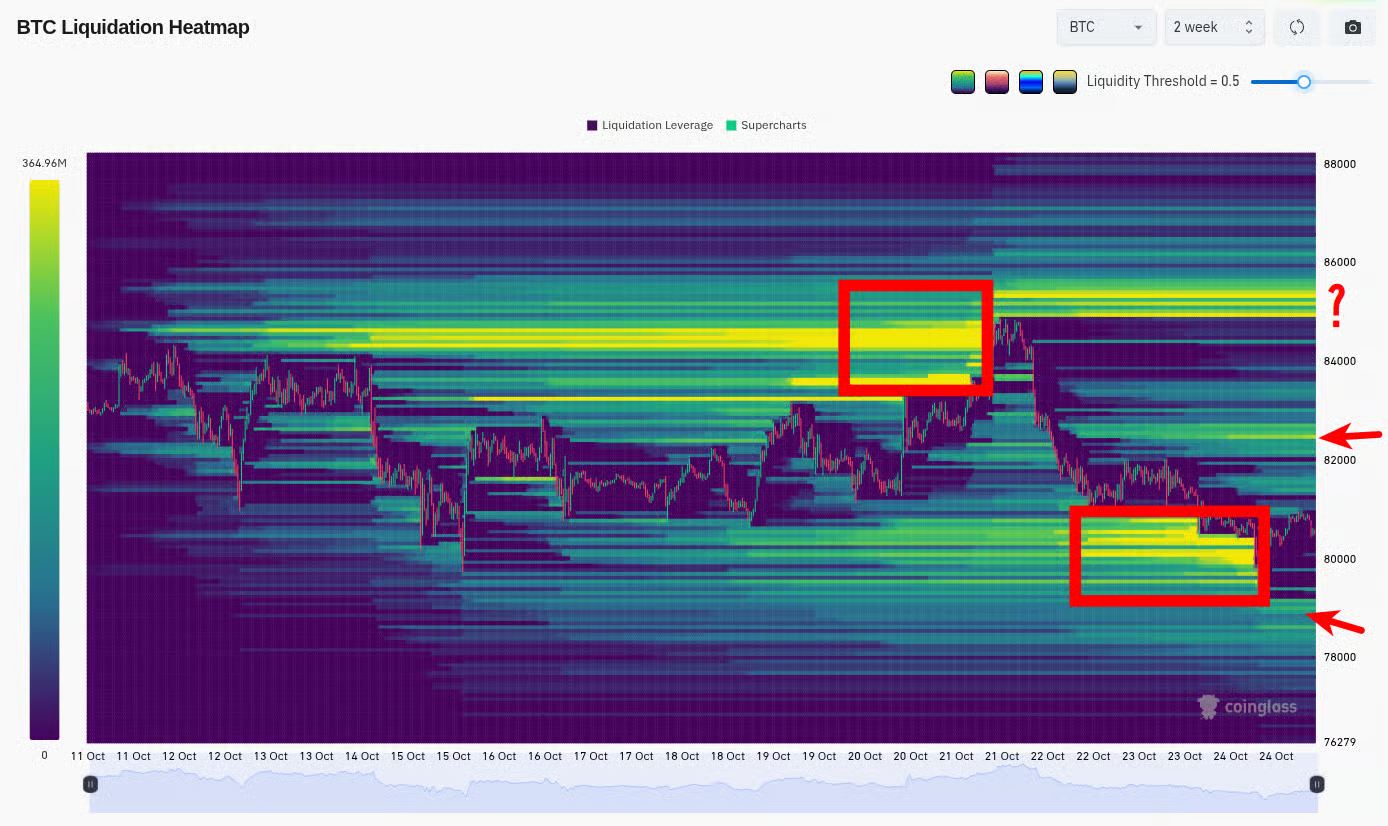
During the past week, the market cleared two major clusters of accumulated short and long positions, highlighted by the red rectangles on the liquidation heatmap.
The question now is when Bitcoin might move toward the remaining short-position liquidity around $85,000.
Over a shorter time horizon, I would focus more closely on the areas around $82,500 and $78,600.
Both levels are beginning to attract substantial concentrations of leveraged positions on opposite sides of the market.
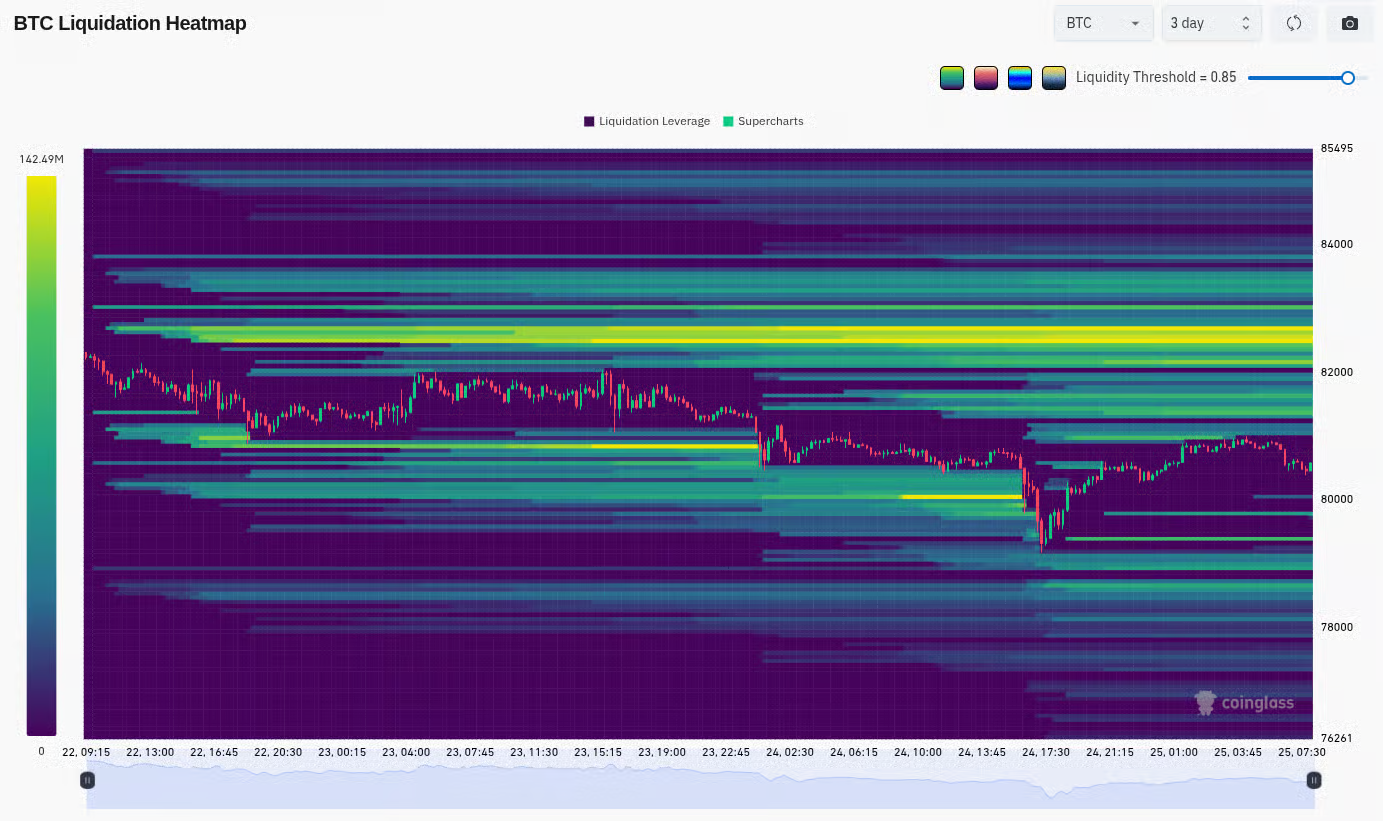
When we narrow the analysis to the past three days, the picture becomes more interesting.
A much larger concentration of liquidity has accumulated above the current price.
There are literally hundreds of millions of dollars in leveraged positions clustered above $82,500.
That creates a powerful liquidity magnet, and I would not be surprised to see Bitcoin move toward this level in the near future.
Is Bitcoin Worth Buying at Current Prices?
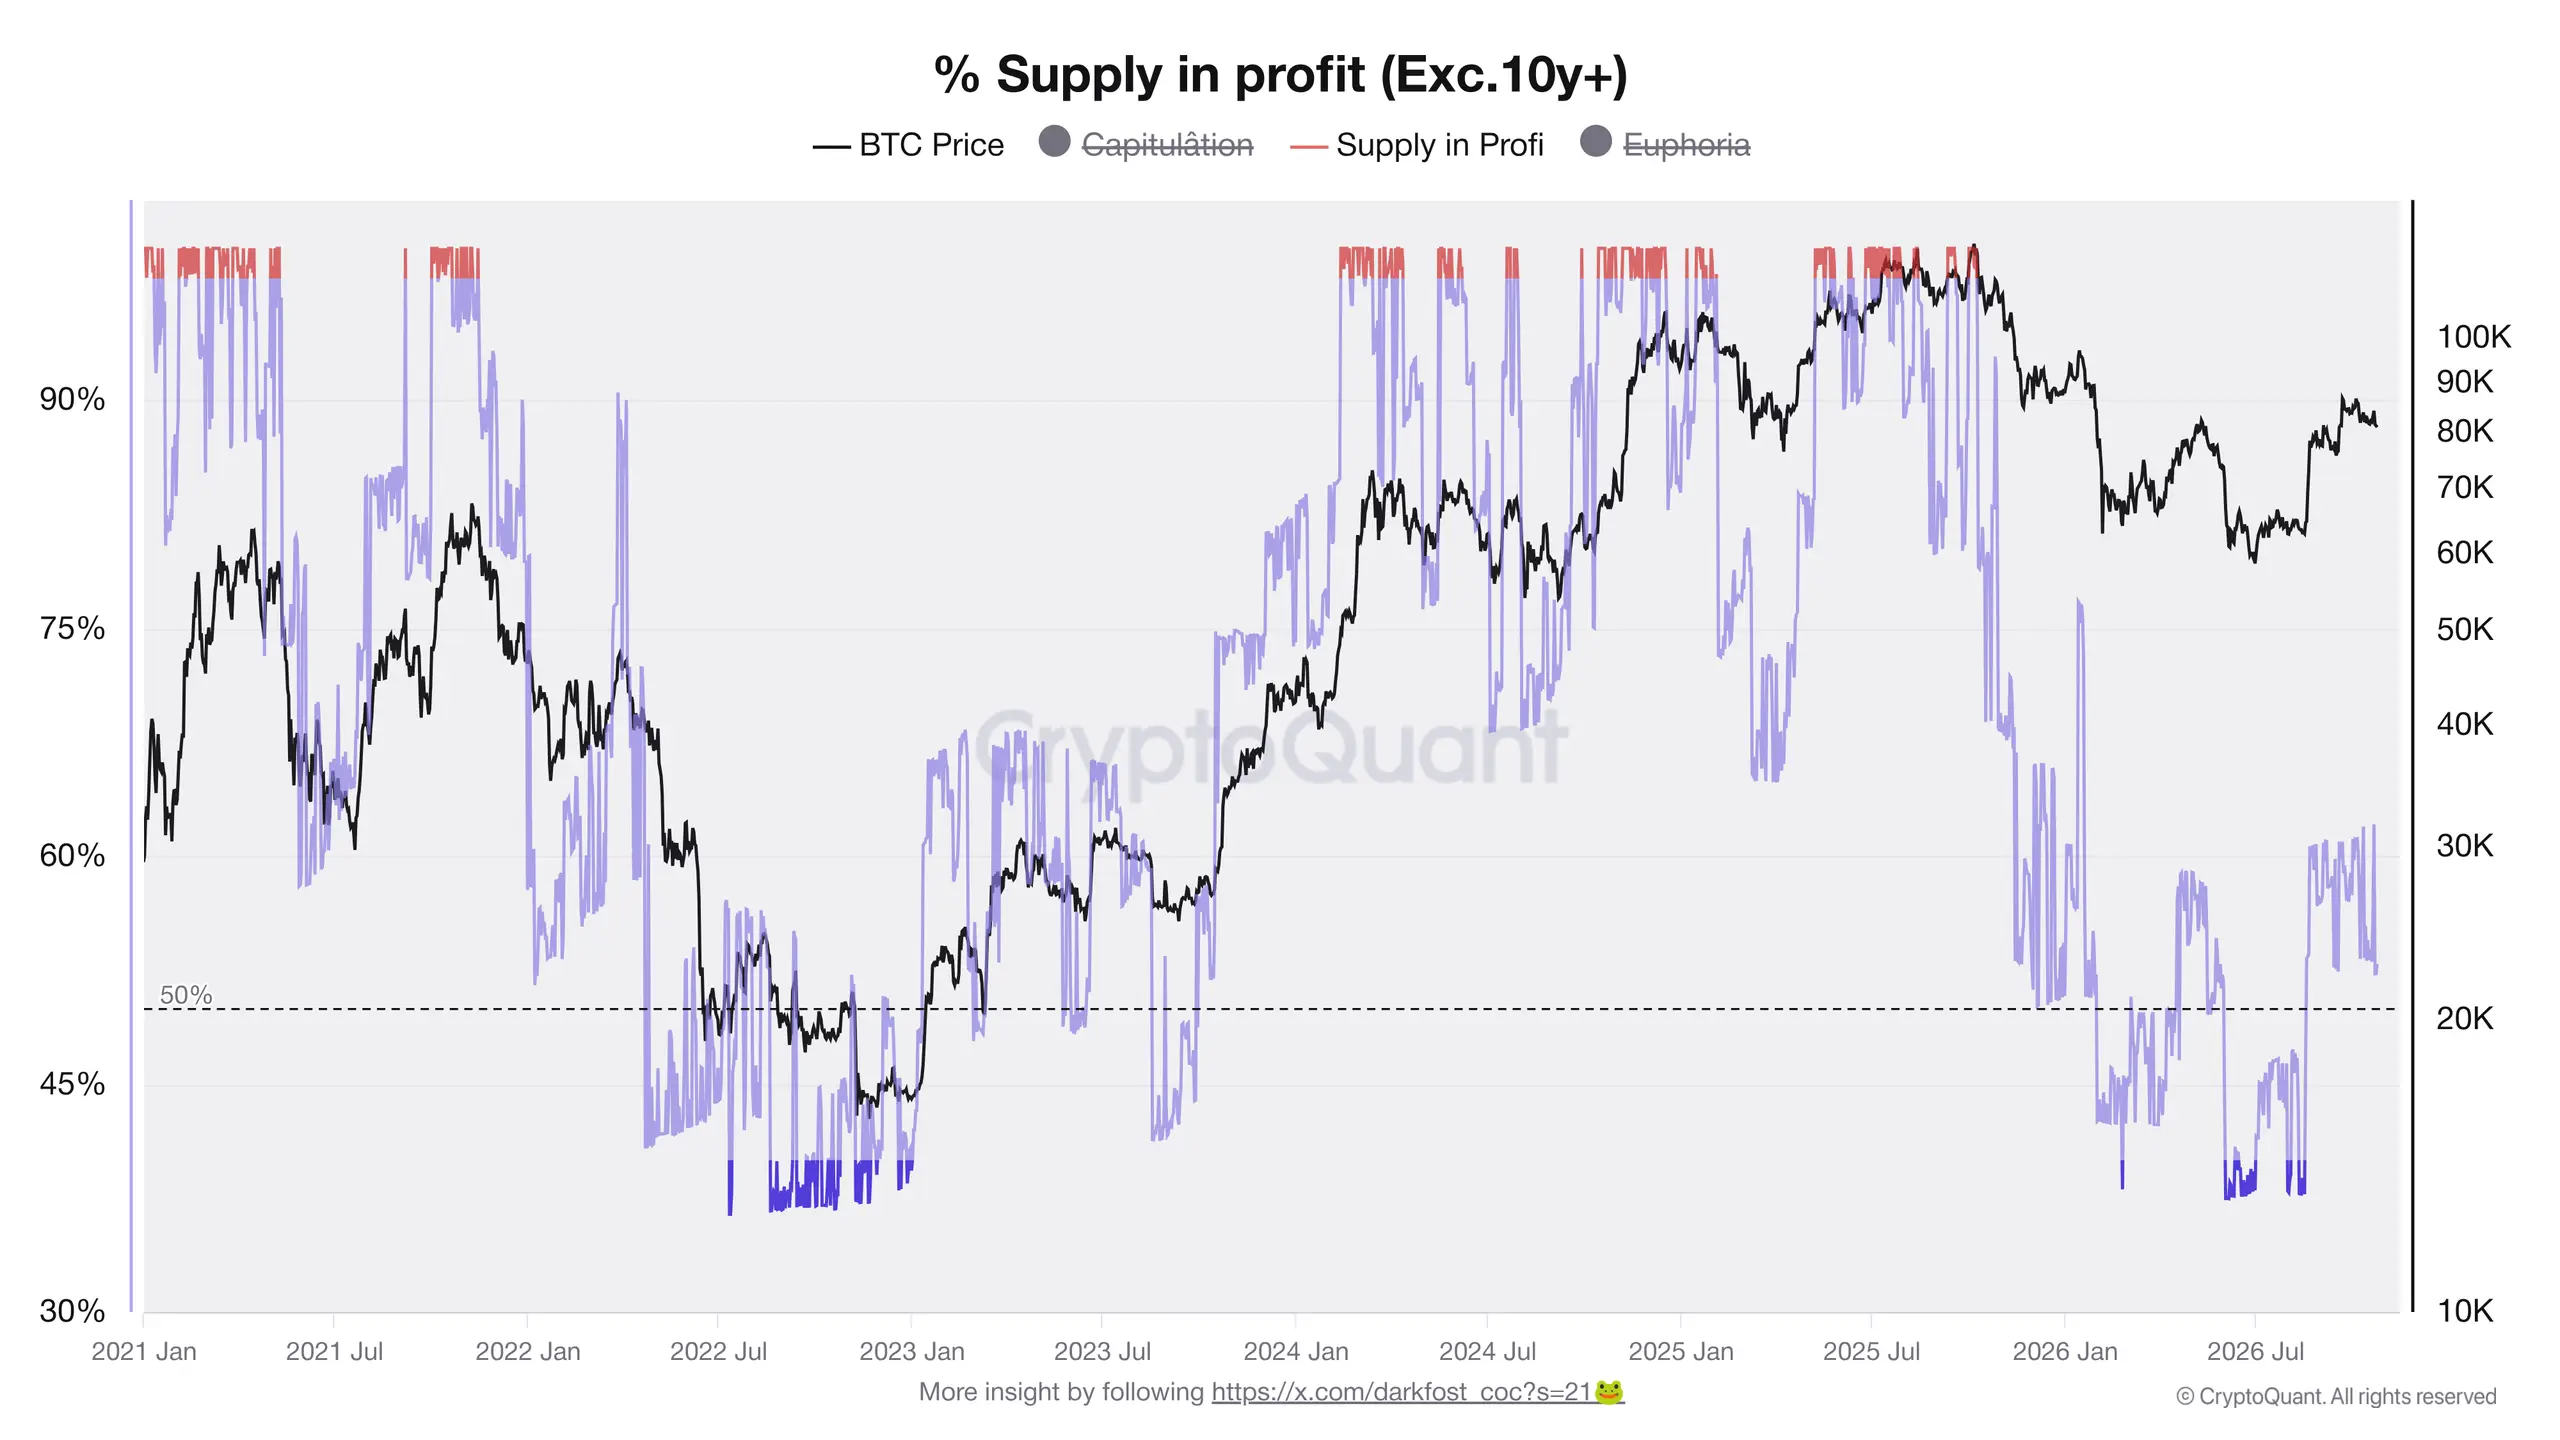
When examining Bitcoin purchased during the past decade, the on-chain data offers an interesting perspective on the broader market cycle.
For the purposes of this analysis, I treat coins that have remained dormant for more than ten years as either permanently lost or held by investors with no intention of selling.
The chart begins in January 2021, allowing us to compare profitability across different market environments.
During strong bull markets, the proportion of Bitcoin held at a profit reaches extremely elevated levels, shown in red. During bear markets, the indicator falls into the dark blue zone.
The gradual recovery that began in early 2023 is particularly revealing.
Currently, 52.9% of Bitcoin acquired during the past ten years is held at a profit.
That is hardly an extreme reading. However, it also suggests that the market is not facing unusually strong profit-taking pressure.
From my perspective, this looks like a relatively healthy and sustainable market structure.
Another chart supports this interpretation.
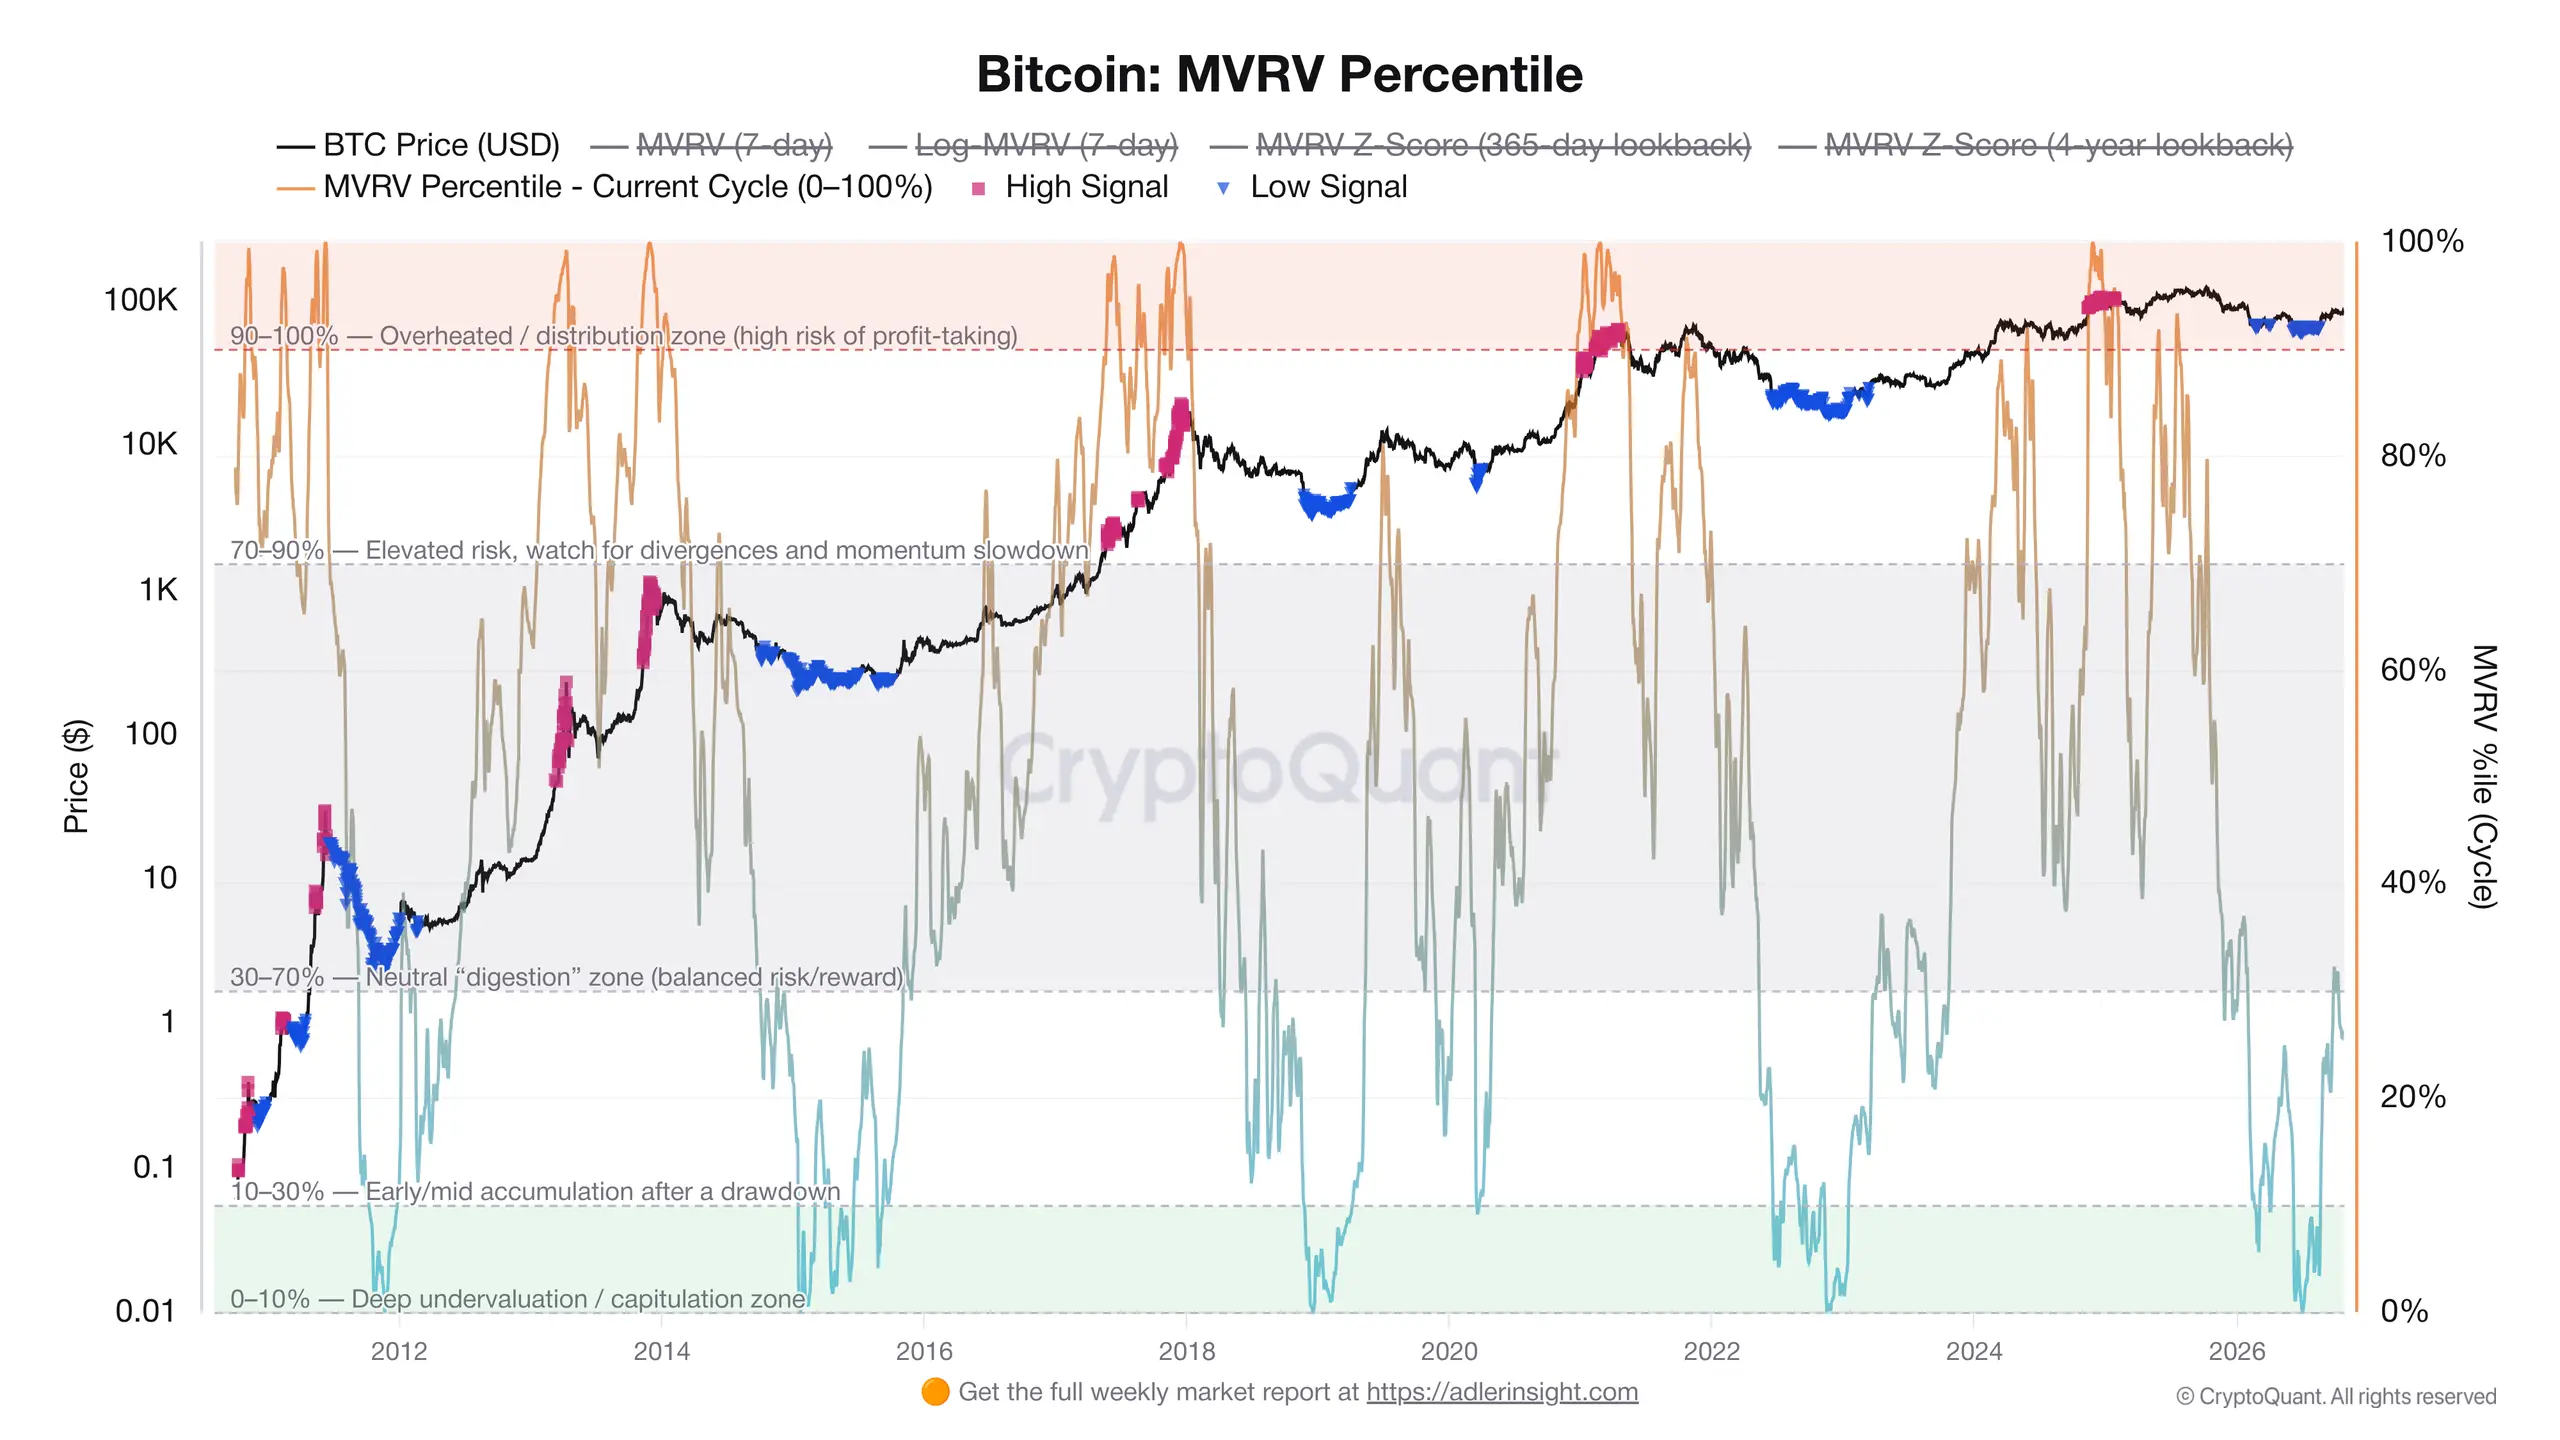
It presents an enhanced version of the MVRV ratio (Market Value to Realized Value), using historical percentiles to provide additional context.
The data suggests that Bitcoin has already moved beyond the capitulation phase and is now trading in a post-correction accumulation zone.
Historically, such conditions have offered attractive opportunities to accumulate Bitcoin at relatively low valuations ahead of potential future gains.
What Should Investors Watch Next Week?
The most important event on next week’s calendar will undoubtedly be Wednesday’s Federal Reserve policy meeting.
The rate decision is scheduled for 7:00 p.m. Central European Time, followed by Fed Chair Kevin Warsh’s press conference at 7:30 p.m.
One important detail: Europe has switched to standard time this weekend, while the United States will not change its clocks until the following week.
As a result, the Fed announcement will arrive one hour earlier than European investors are normally accustomed to.
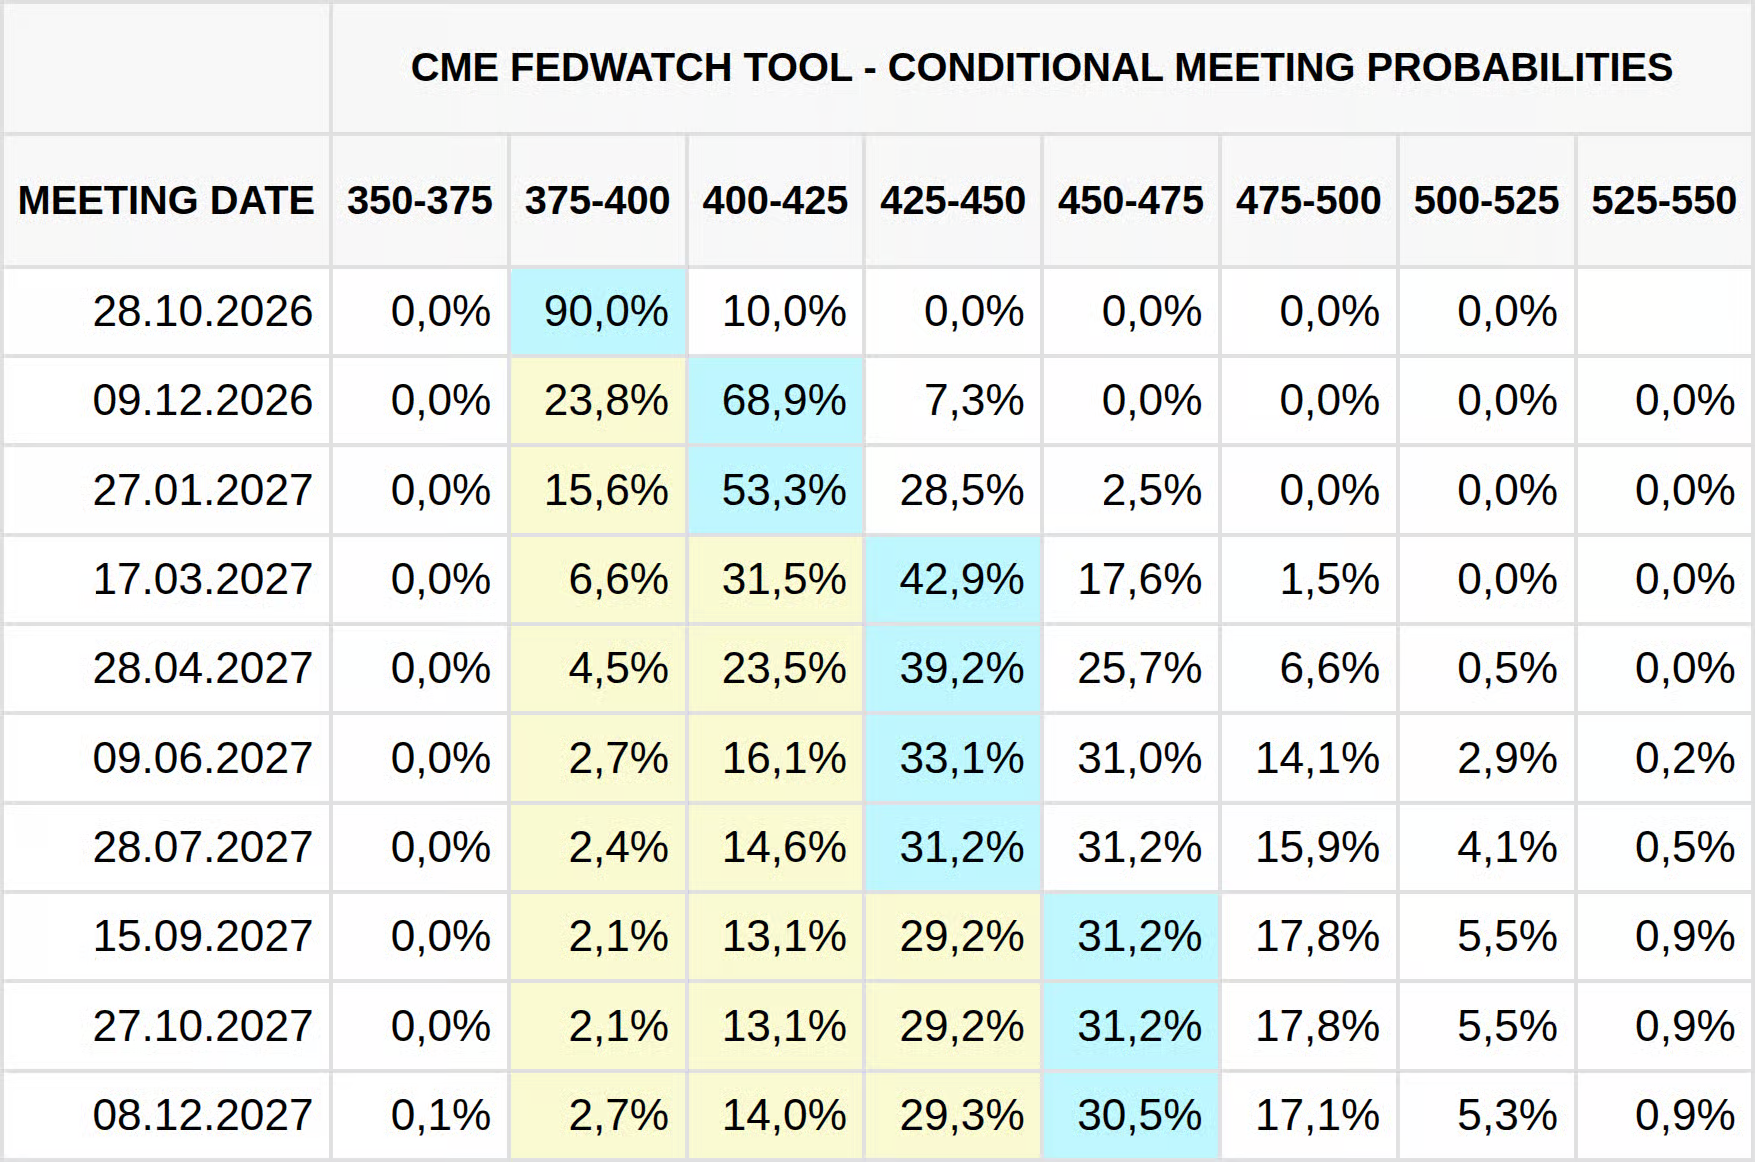
According to the CME FedWatch Tool, only around 10% of traders expect an interest rate increase at Wednesday’s meeting.
However, markets are pricing in approximately a 69% probability of a rate hike in December.
That makes Warsh’s comments during the press conference particularly important, especially if there are dissenting votes among policymakers.
Any meaningful divergence between market expectations and the Fed’s messaging could trigger substantial volatility.
The US midterm elections are now just nine days away.
Americans will vote in congressional elections on November 3, and according to Thursday’s report in The New York Times, the outcome could also influence plans for potential military action against Iran.
I expect President Donald Trump to make further statements before election day, and almost anything he says about Iran or energy policy could move oil prices and financial markets.
For me, oil is currently the single most important macroeconomic indicator.
Brent crude remains above $110 per barrel, contributing to elevated inflation expectations and bond yields.
Tuesday’s diplomatic reports demonstrated just how quickly a decline in oil prices can support Bitcoin.
Confirmation of a meaningful agreement with Iran could provide the strongest bullish catalyst of the week.
Conversely, renewed escalation around the Strait of Hormuz would likely exert additional downward pressure on risk assets.
There are also several important economic releases to watch.
On Thursday at 1:30 p.m. Central European Time, the United States is scheduled to publish its initial estimate of third-quarter GDP alongside the Personal Consumption Expenditures (PCE) inflation data.
Friday will bring another important event for cryptocurrency derivatives.
At 9:00 a.m. Central European Time, daily, weekly and monthly Bitcoin options are scheduled to expire on Deribit.
The combined notional value currently stands at approximately $10.9 billion, with a maximum pain price of $78,000.
However, only around $1.5 billion worth of these options are currently in the money (ITM).
Where Is Bitcoin Heading Next?
Let’s bring the different timeframes together.
On the hourly chart, Bitcoin has rebounded toward $80,500 following Saturday’s sell-off, while the RSI has recovered to approximately 46.
The four-hour chart is testing the lower boundary of a descending triangle near $80,750, with the market attempting to determine whether former support has become resistance.
On the daily chart, Bitcoin may already have reached the projected downside target of the double-top pattern around $80,150.
Although the price remains below its 50-day moving average, a hidden bullish divergence continues to develop.
Meanwhile, the weekly chart suggests that Bitcoin is testing the upper boundary of a broader Wyckoff accumulation range.
The bullish scenario begins with a recovery above $81,800.
That level combines the 50DMA with the 127.2% Fibonacci extension, making it an important technical threshold.
A convincing breakout would strengthen the case for another attempt to overcome the descending triangle’s resistance and advance toward $83,450.
That area also coincides with the neckline of the double-top formation.
Only a sustained move above this resistance zone would open the door to approximately $85,300.
The bearish alternative would gain credibility if Bitcoin recorded a daily or weekly close below $80,000.
In that case, the next support levels would be $79,430 and $78,620, followed by the green support zone around $75,600.
This lower area is especially interesting because it combines the descending triangle’s measured downside target with the aggregate cost basis of short-term Bitcoin holders.
The broader indicators remain mixed.
On the positive side, spot ETF flows have returned to positive territory for the week, while excessive speculative positioning has been cleared without evidence of widespread spot-market selling.
The on-chain metrics also support the broader bull-market thesis and suggest that current valuations remain attractive.
On the negative side, oil prices are elevated, stablecoin balances on exchanges are declining, and uncertainty surrounding the Fed and US elections remains significant.
My view is that macroeconomic developments will ultimately determine Bitcoin’s next major move, with Wednesday likely to be particularly decisive.
How Am I Planning to Trade Bitcoin?
Looking at the overall picture, I still see a meaningful possibility that Bitcoin could fall toward $75,000.
Nevertheless, I am positioning for an upward move this time.
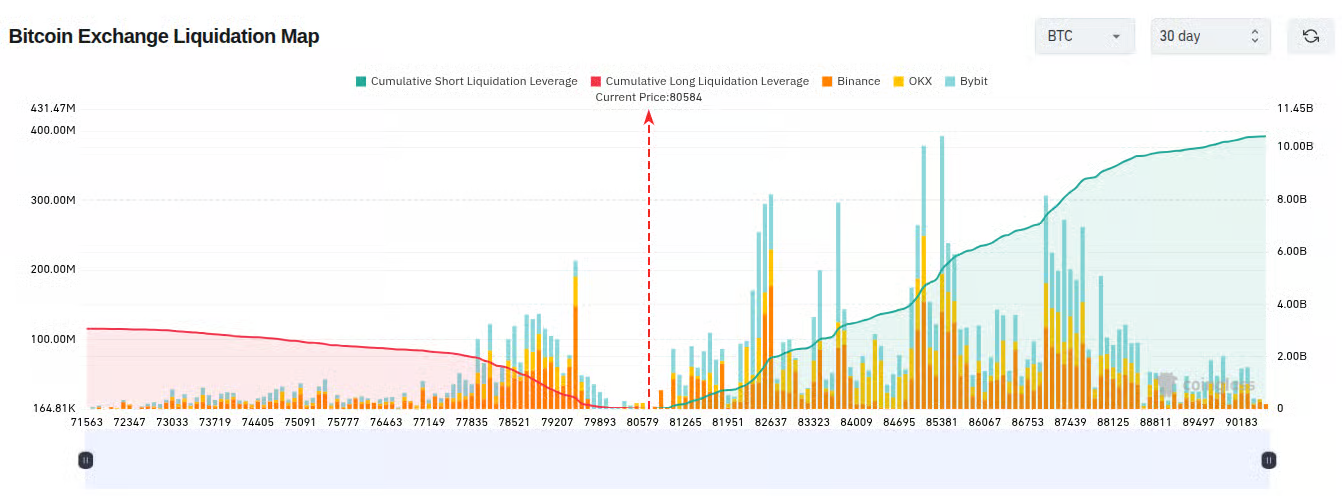
From a short-term perspective, there is a substantial concentration of leveraged liquidity around $82,500.
The imbalance becomes even more striking when examining the cumulative liquidation map covering the past month.
I will also admit that part of my bullish outlook is based on expectations surrounding Donald Trump.
High oil prices are hardly something the president would welcome immediately before an election.
I therefore expect major announcements, public statements or potential diplomatic agreements intended to improve market sentiment.
A meaningful decline in oil prices could quickly push Bitcoin higher, as demonstrated by Tuesday’s reaction to reports of a possible agreement with Iran.
Toward the end of the week, I opened several relatively small long positions. Unfortunately, they were stopped out on Saturday.
The losses were limited and, looking at current prices, might appear unnecessary in hindsight.
However, I am not a fan of moving stop-loss orders once a trade has been established. In my experience, that is a dangerous habit.
My next plan is to prepare a series of long entries extending down toward $78,600, which corresponds to the 61.8% Fibonacci level.
Looking at the cumulative monthly liquidation map, relatively little liquidity remains below that region.
I am also placing some weight on Wednesday’s Fed decision.
If policymakers disagree on the appropriate direction of interest rates, it could weaken market expectations for further increases.
Markets currently anticipate three additional rate hikes over the next 12 months, and any reduction in those expectations could provide another reason for Bitcoin to rally.
