



Bitcoin closed September at 83,570 USD, gaining more than 6% over the month. That marks a clear slowdown from August’s 25% rally, but the monthly close came above two key technical levels that, in my view, matter far more than the size of the gain itself.
Bitcoin’s September performance may look modest compared with August, but it still represents another positive month – and one that came during what has historically been a difficult period for the cryptocurrency.
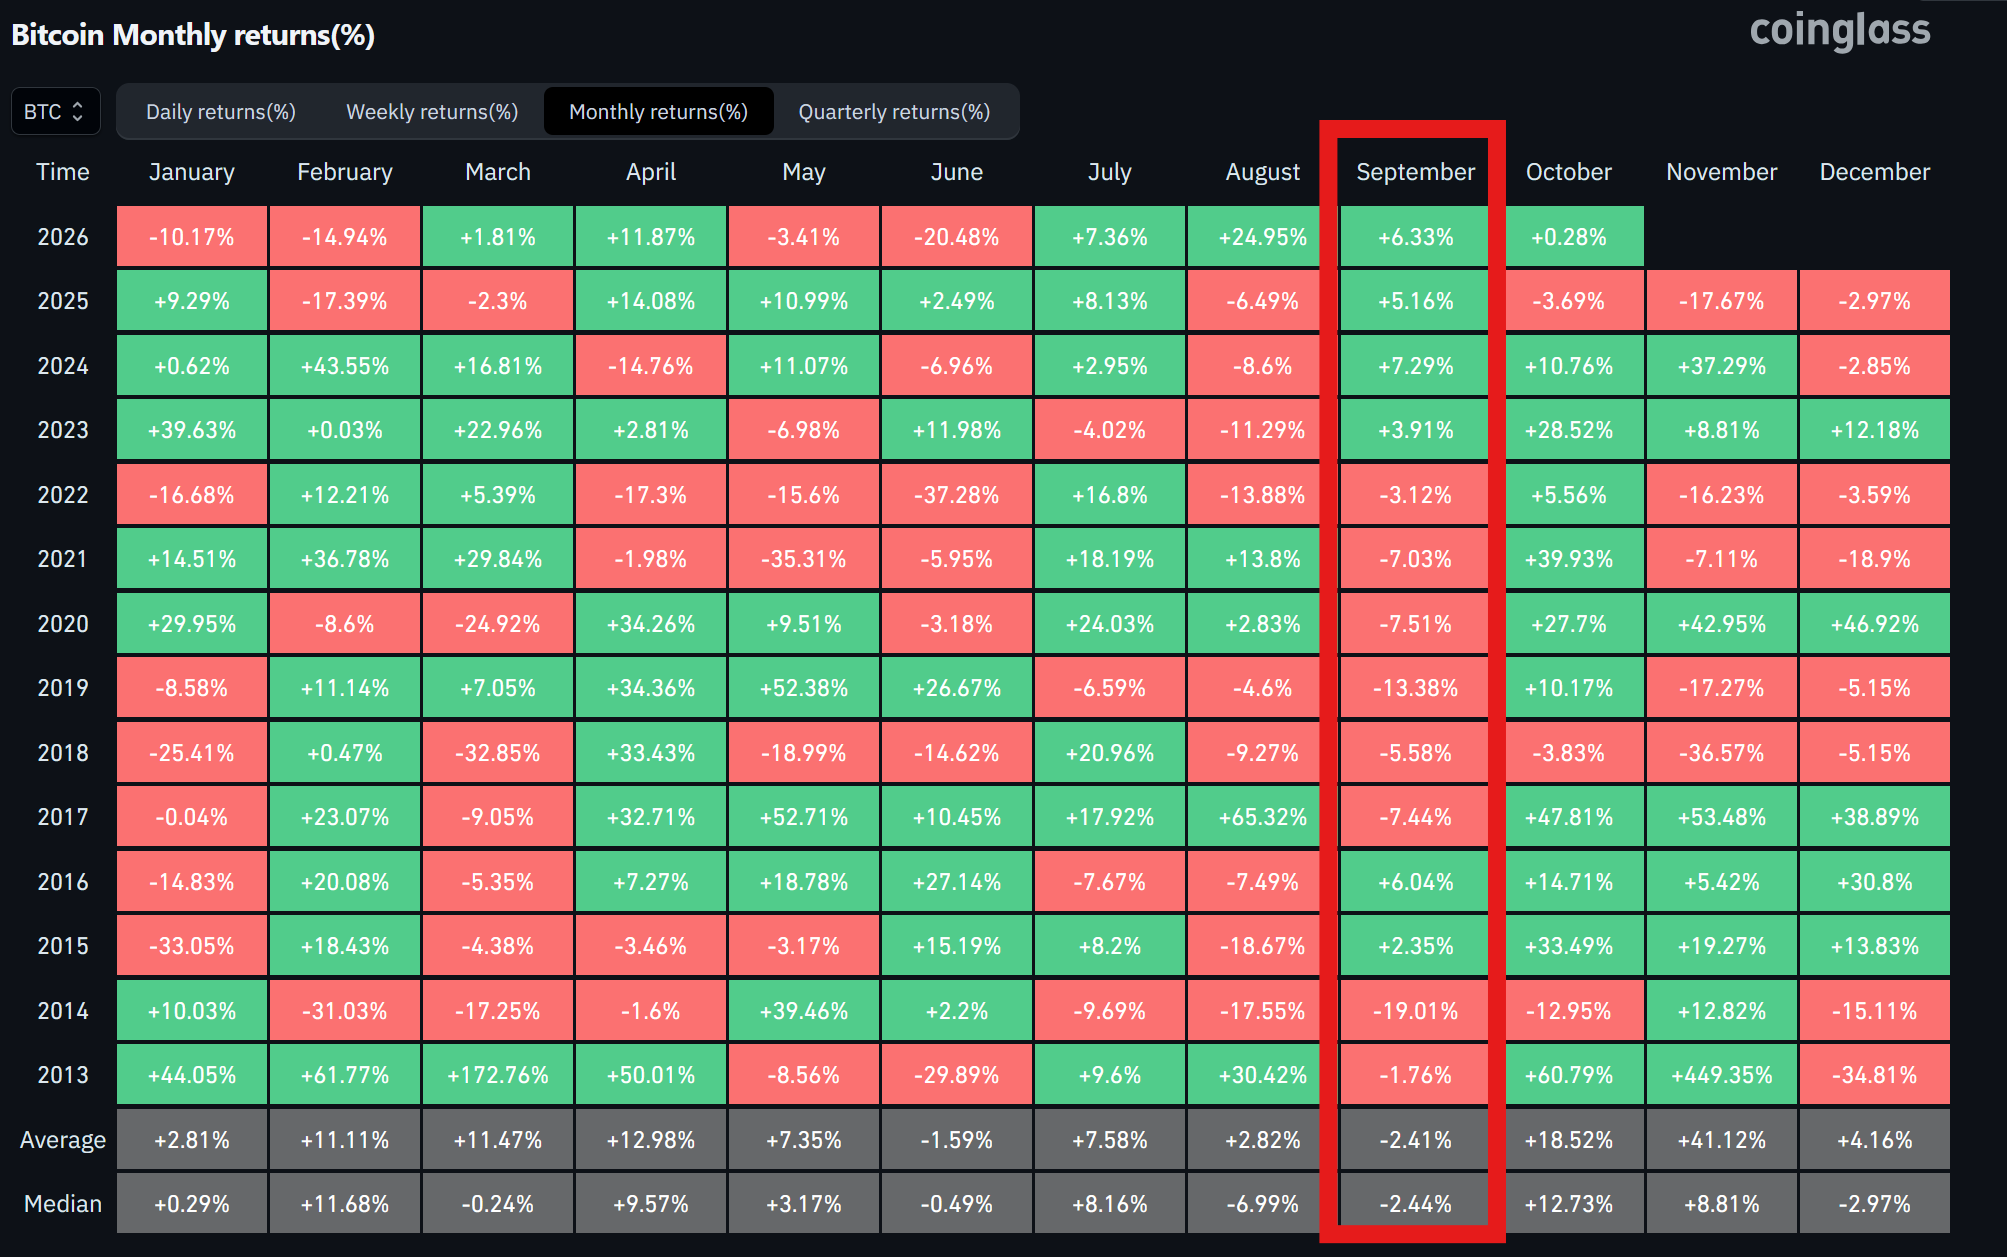
According to CoinGlass data, September has historically been Bitcoin’s weakest month, with an average return of roughly -2.4%. Since 2013, eight out of thirteen September candles have closed in negative territory.
There is another notable detail. Since 2013, every positive August had been followed by a negative September. This year finally broke that pattern, with Bitcoin recording its third consecutive monthly gain.
Bitcoin Closed Above a Key Support Zone and the May High
The most important development is where the September candle closed.
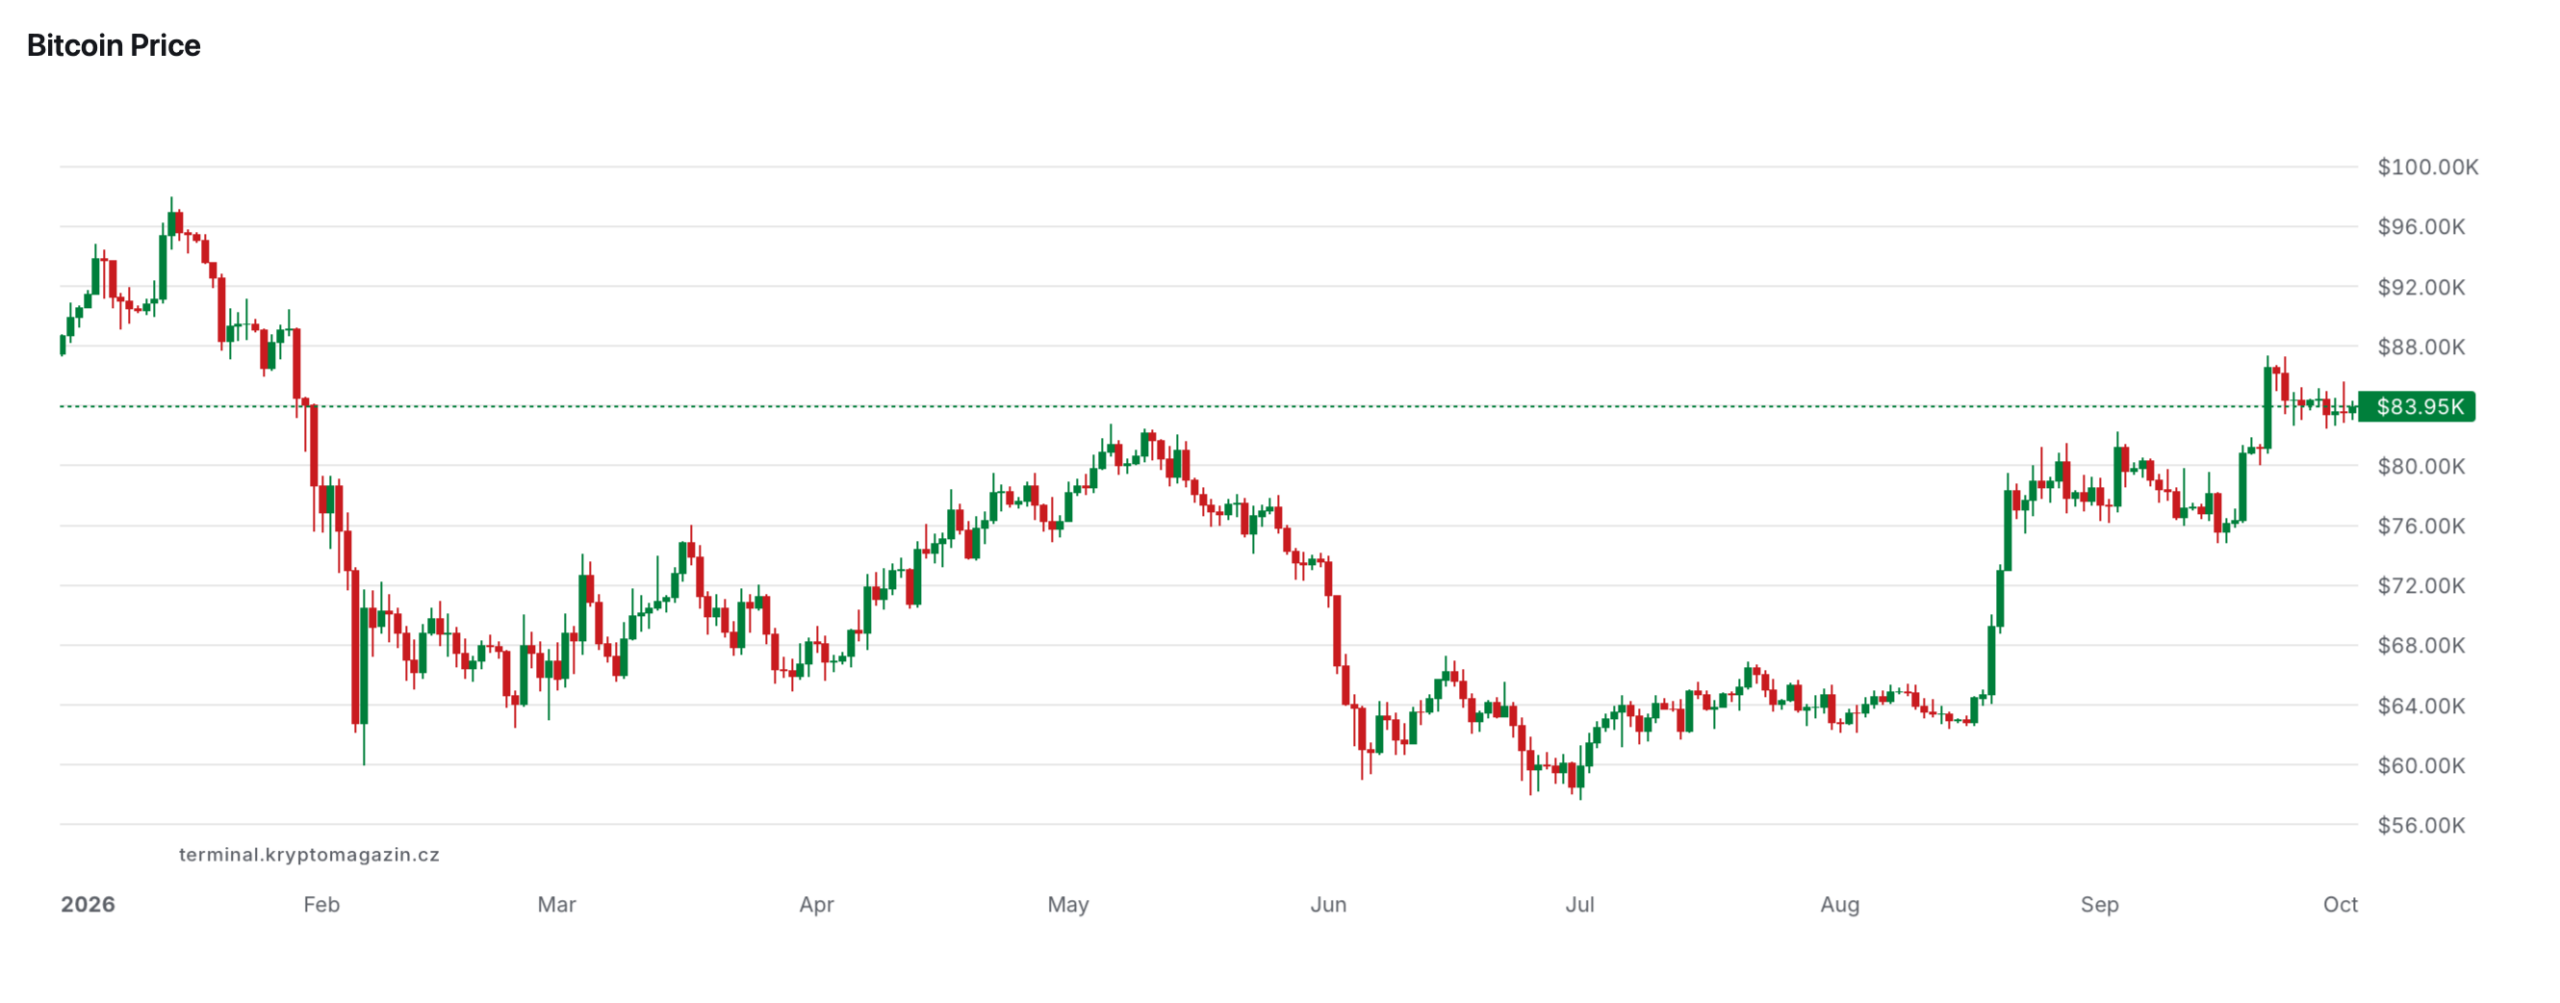
Bitcoin remained above the key support area around 82,000 USD, while also closing above its May high. From a technical perspective, that makes September far more constructive than the headline 6% gain might suggest.
The two levels effectively form one broader price zone. Bitcoin’s May high was just above 82,000 USD and acted as resistance at the time. The rally stalled there before the market sold off in June, eventually falling below 60,000 USD.
That same area is now showing signs of flipping from resistance into support.
A monthly close above the zone also carries considerably more weight than a brief intraday breakout. Short-lived moves can be driven by individual large orders or thin liquidity, while a monthly close reflects sustained demand over a much longer period.
I previously argued that Bitcoin still needed to establish a higher high followed by a higher low to strengthen the bullish market structure. The September close above the May peak effectively delivers the first part of that setup.
The Technical Picture Still Points to a Bitcoin Bull Market
From a technical standpoint, the latest monthly close provides further evidence that Bitcoin remains in a broader bullish trend.
The cryptocurrency has now posted three consecutive green monthly candles. It has also broken above the descending trendline extending from the October 2025 peak and, so far, continues to trade above it.
Still, the slowdown in momentum should not be ignored. Moving from a 25% monthly gain in August to around 6% in September suggests that buying pressure has weakened.
That could lead to a pullback or several weeks of sideways consolidation before Bitcoin makes another attempt to move higher.
Historical seasonality would suggest otherwise. October has traditionally been one of Bitcoin’s strongest months, with a median return of roughly 14.7%. I would not place too much weight on seasonality, however. At best, I consider it a secondary factor — and this September is a good example of why historical monthly patterns should not be treated as rules.
Bitcoin Followed a Similar Pattern at the Start of the Previous Cycle
Interestingly, Bitcoin behaved in a very similar way during the early stages of the previous market cycle.
Bitcoin gained almost 40% in January 2023, traded roughly flat in February, and then surged by around 23% in March. After that move, however, the market spent roughly six months consolidating between 25,000 and 31,000 USD.
That is why I do not necessarily see the current slowdown as a negative development. Periods of consolidation are a normal part of a broader market expansion, particularly after a sharp initial rally.
For now, I would consider a weekly close back below 82,000 USD the first meaningful warning sign.
A drop below 70,000 USD, on the other hand, would represent a much more significant deterioration in Bitcoin’s current technical structure.
