Bitcoin surged at the start of the week, briefly fueling hopes that a new bull market had begun. By the weekend, however, much of the advance had disappeared. With the weekly candle still open, the key question is whether Bitcoin can establish a higher high above 82,154 USD or whether geopolitical tensions around the Strait of Hormuz could push the market back toward bearish territory.
The Weekly High Came on Monday, Followed by a Steady Decline
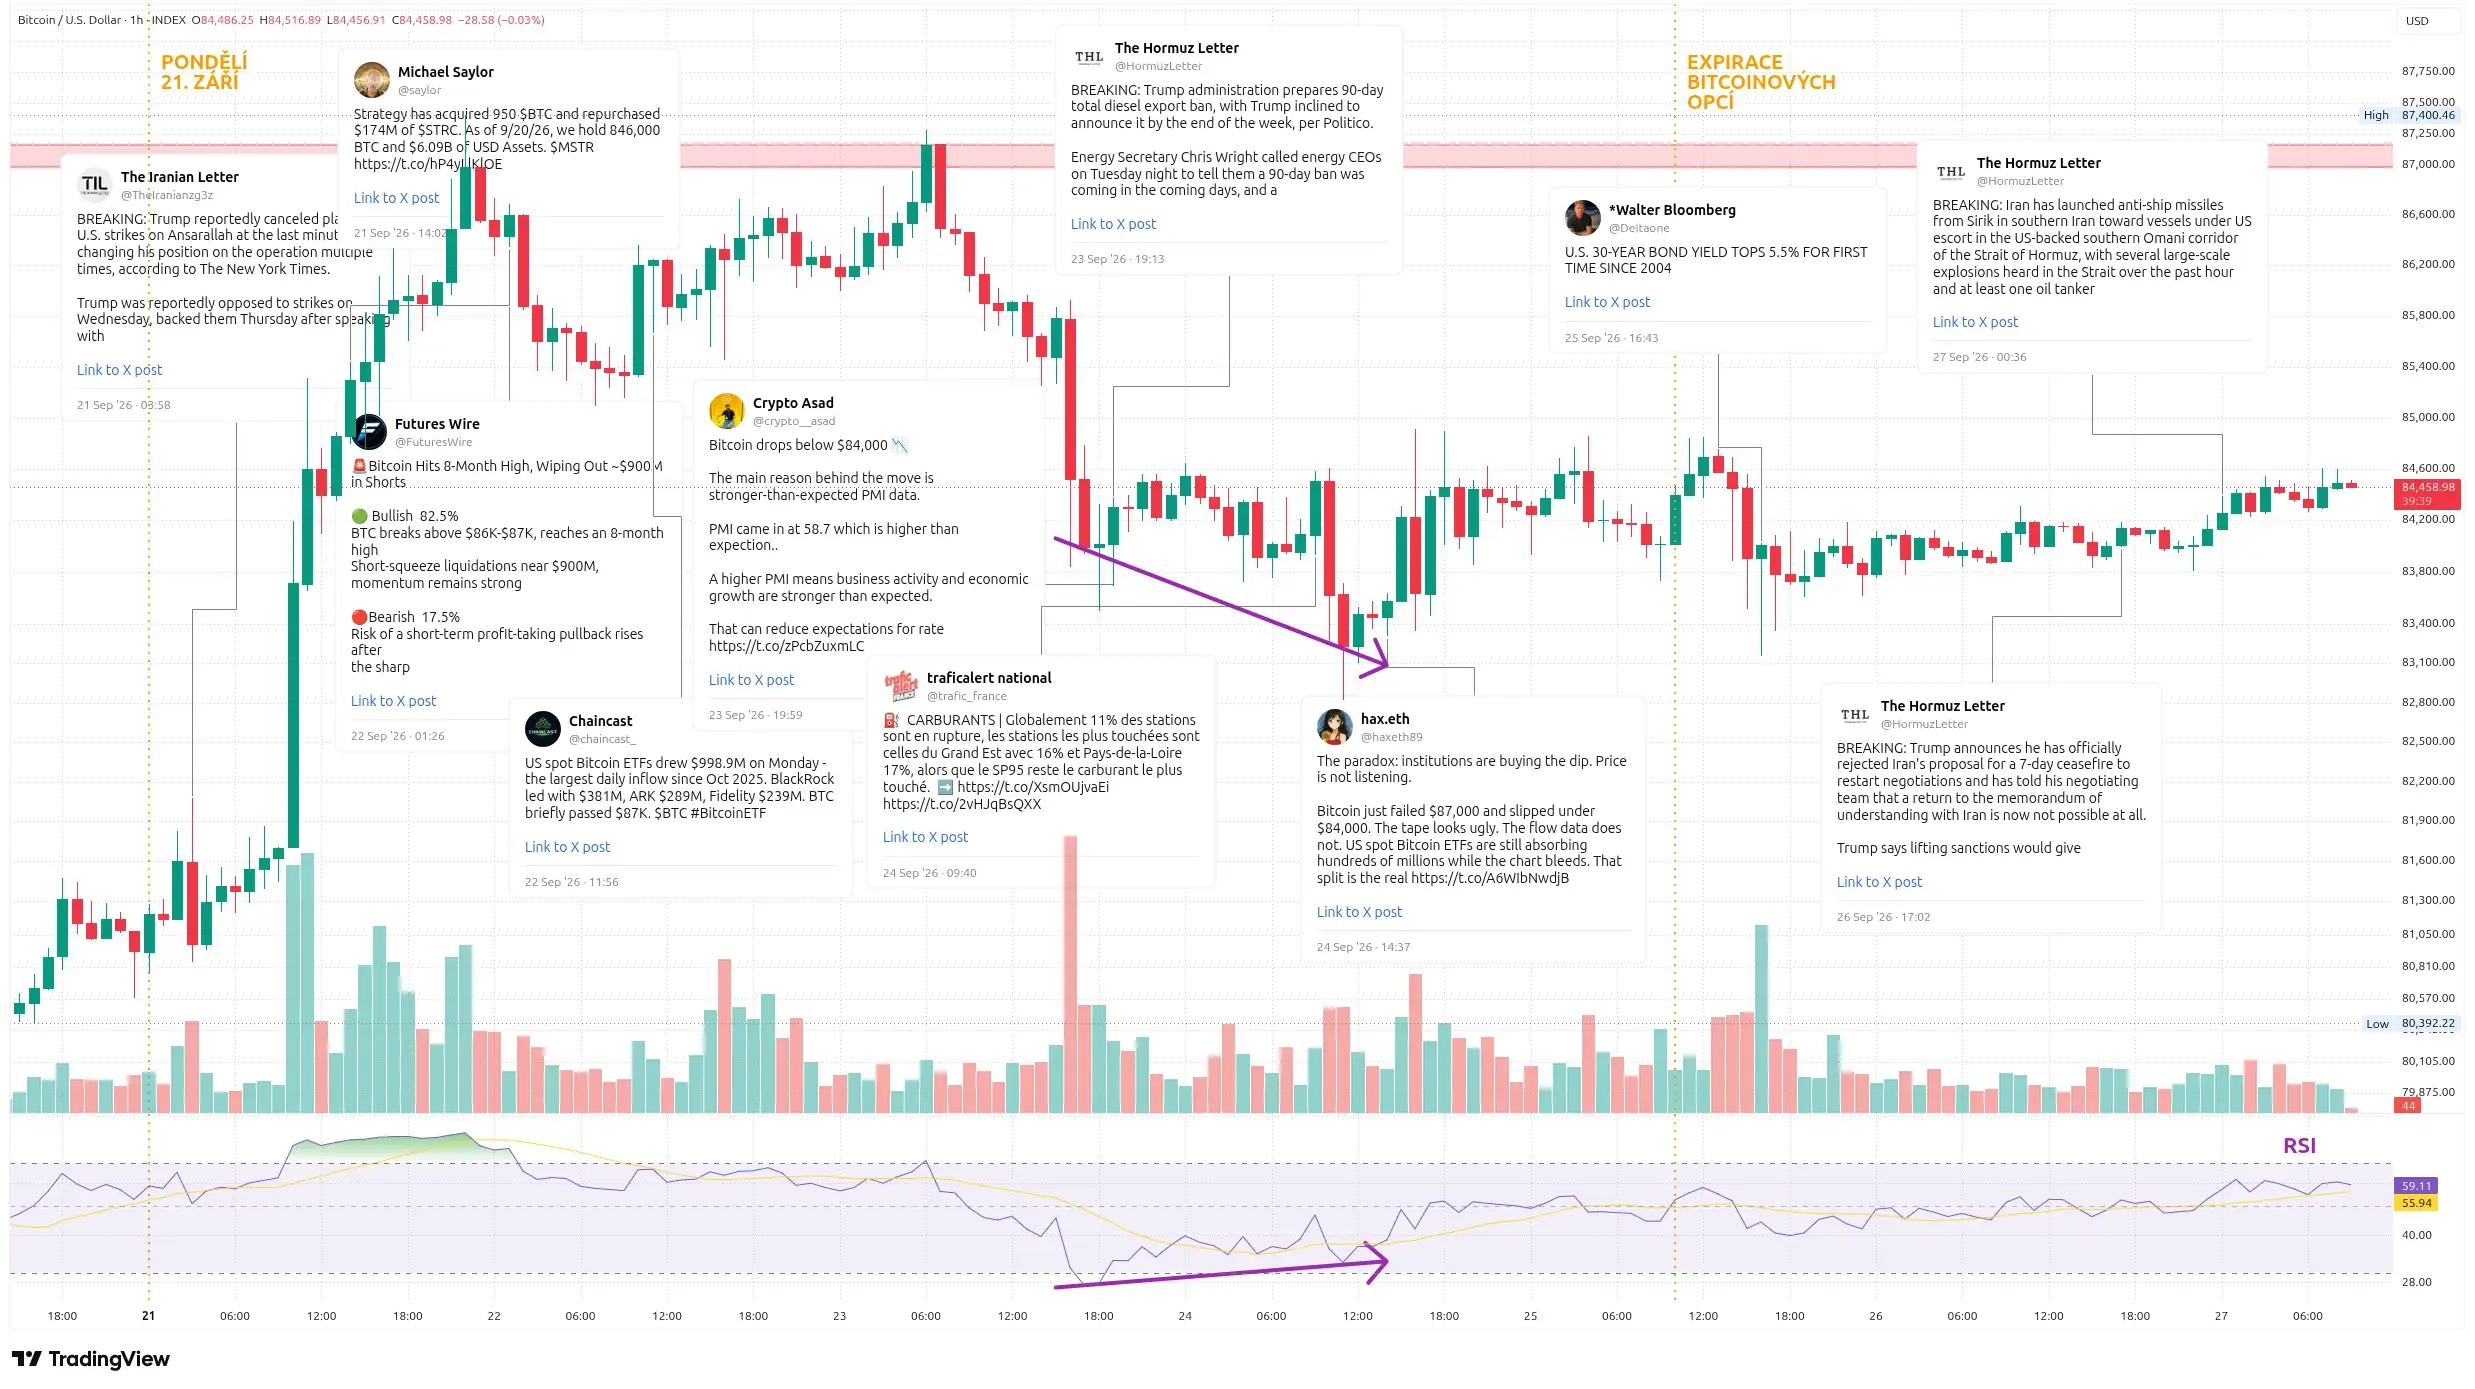
Sunday evening was dominated by expectations of a possible attack on Iran. Airspace had reportedly been cleared, embassies warned their citizens, and several aerial refueling aircraft were active over the Persian Gulf. Bitcoin moved around 81,000 USD shortly after midnight.
The situation changed when reports emerged that Donald Trump had canceled the attack order at the last moment. After a brief burst of volatility, Bitcoin began climbing into the European session. By 10:00, the Relative Strength Index (RSI) was already above 70, but the rally continued. When Strategy announced the purchase of another 950 BTC, Bitcoin was trading near 84,800 USD.
Instead of the decline that often follows Strategy purchase announcements, the price kept rising. By the New York close, Bitcoin was near 86,500 USD, and within the next hour it reached roughly 87,400 USD.
That became the weekly high, with hourly RSI reaching 88.5. The 87,000 USD level quickly proved to be strong resistance. Bitcoin was rejected and closed the hour below it. Around 1.1 billion USD in derivatives positions were liquidated, about 85% of them shorts — a textbook short squeeze.
During Asian trading, Bitcoin pulled back on weaker volume and was back near 85,200 USD on Tuesday morning. European buyers then stepped in, helped by strong inflows into spot Bitcoin ETFs. Monday’s inflows reached 999 million USD, the ninth-largest daily increase since the products launched in January 2024. Within an hour, Bitcoin returned above 86,300 USD.
The market then consolidated. Early Wednesday morning, Bitcoin briefly closed an hourly candle above 87,000 USD, but the breakout failed again. Weak volume was not enough to sustain the move, and the price fell back toward 85,500 USD by the NYSE open.
Resistance Above 87,000 USD Remains Strong
The second rejection from 87,000 USD came as pressure from the macro environment increased. Oil-market tensions were rising, bond yields were reaching levels not seen for years, and economic activity remained relatively strong. Such conditions increase the risk of further rate hikes, which generally creates a difficult environment for risk assets.
Bitcoin dropped sharply and briefly reached 83,500 USD. Another source of uncertainty was Trump’s reported plan for a 90-day diesel export ban. With the Strait of Hormuz effectively disrupted, Russian oil infrastructure under attack from Ukraine, and fuel shortages appearing in parts of Europe, the energy outlook remained tense.
RSI moved into oversold territory, which helped slow the decline. Bitcoin then traded sideways near 84,400 USD until the European open on Thursday. France reported that 11% of fuel stations had run out of supply, while conditions in the oil market showed little sign of stabilizing.
Another sell-off took Bitcoin to 82,825 USD. The price formed a lower low, while RSI formed a higher low, creating a bullish divergence. Bitcoin recovered to around 84,400 USD, where the market again paused. At the same time, U.S. Treasury yields continued to attract attention. Interestingly, spot Bitcoin ETFs were still receiving billions of dollars even as the price weakened.
Bitcoin Options Expiry Brought the Expected Volatility
Trading volumes on traditional markets remained relatively weak into Friday morning. At 10:00 local time, Bitcoin options worth 14.2 billion USD expired, bringing the expected volatility. Around midday, Bitcoin briefly moved back above 85,000 USD, but the move lasted only a short time.
The price soon turned lower again. U.S. 30-year Treasury yields rose to 5.5%, reaching a level not seen since 2004. Bitcoin fell toward 83,000 USD before finding support and stabilizing near 84,000 USD for much of Saturday.
The market also reacted only modestly to reports that Trump had rejected an Iranian proposal to reopen the Strait of Hormuz. Despite renewed fighting, mine-laying activity and ships avoiding the area, trading volumes suggested that crypto investors had not yet fully priced in the escalation.
The Four-Hour Chart Is Trapped in a Tight Pattern
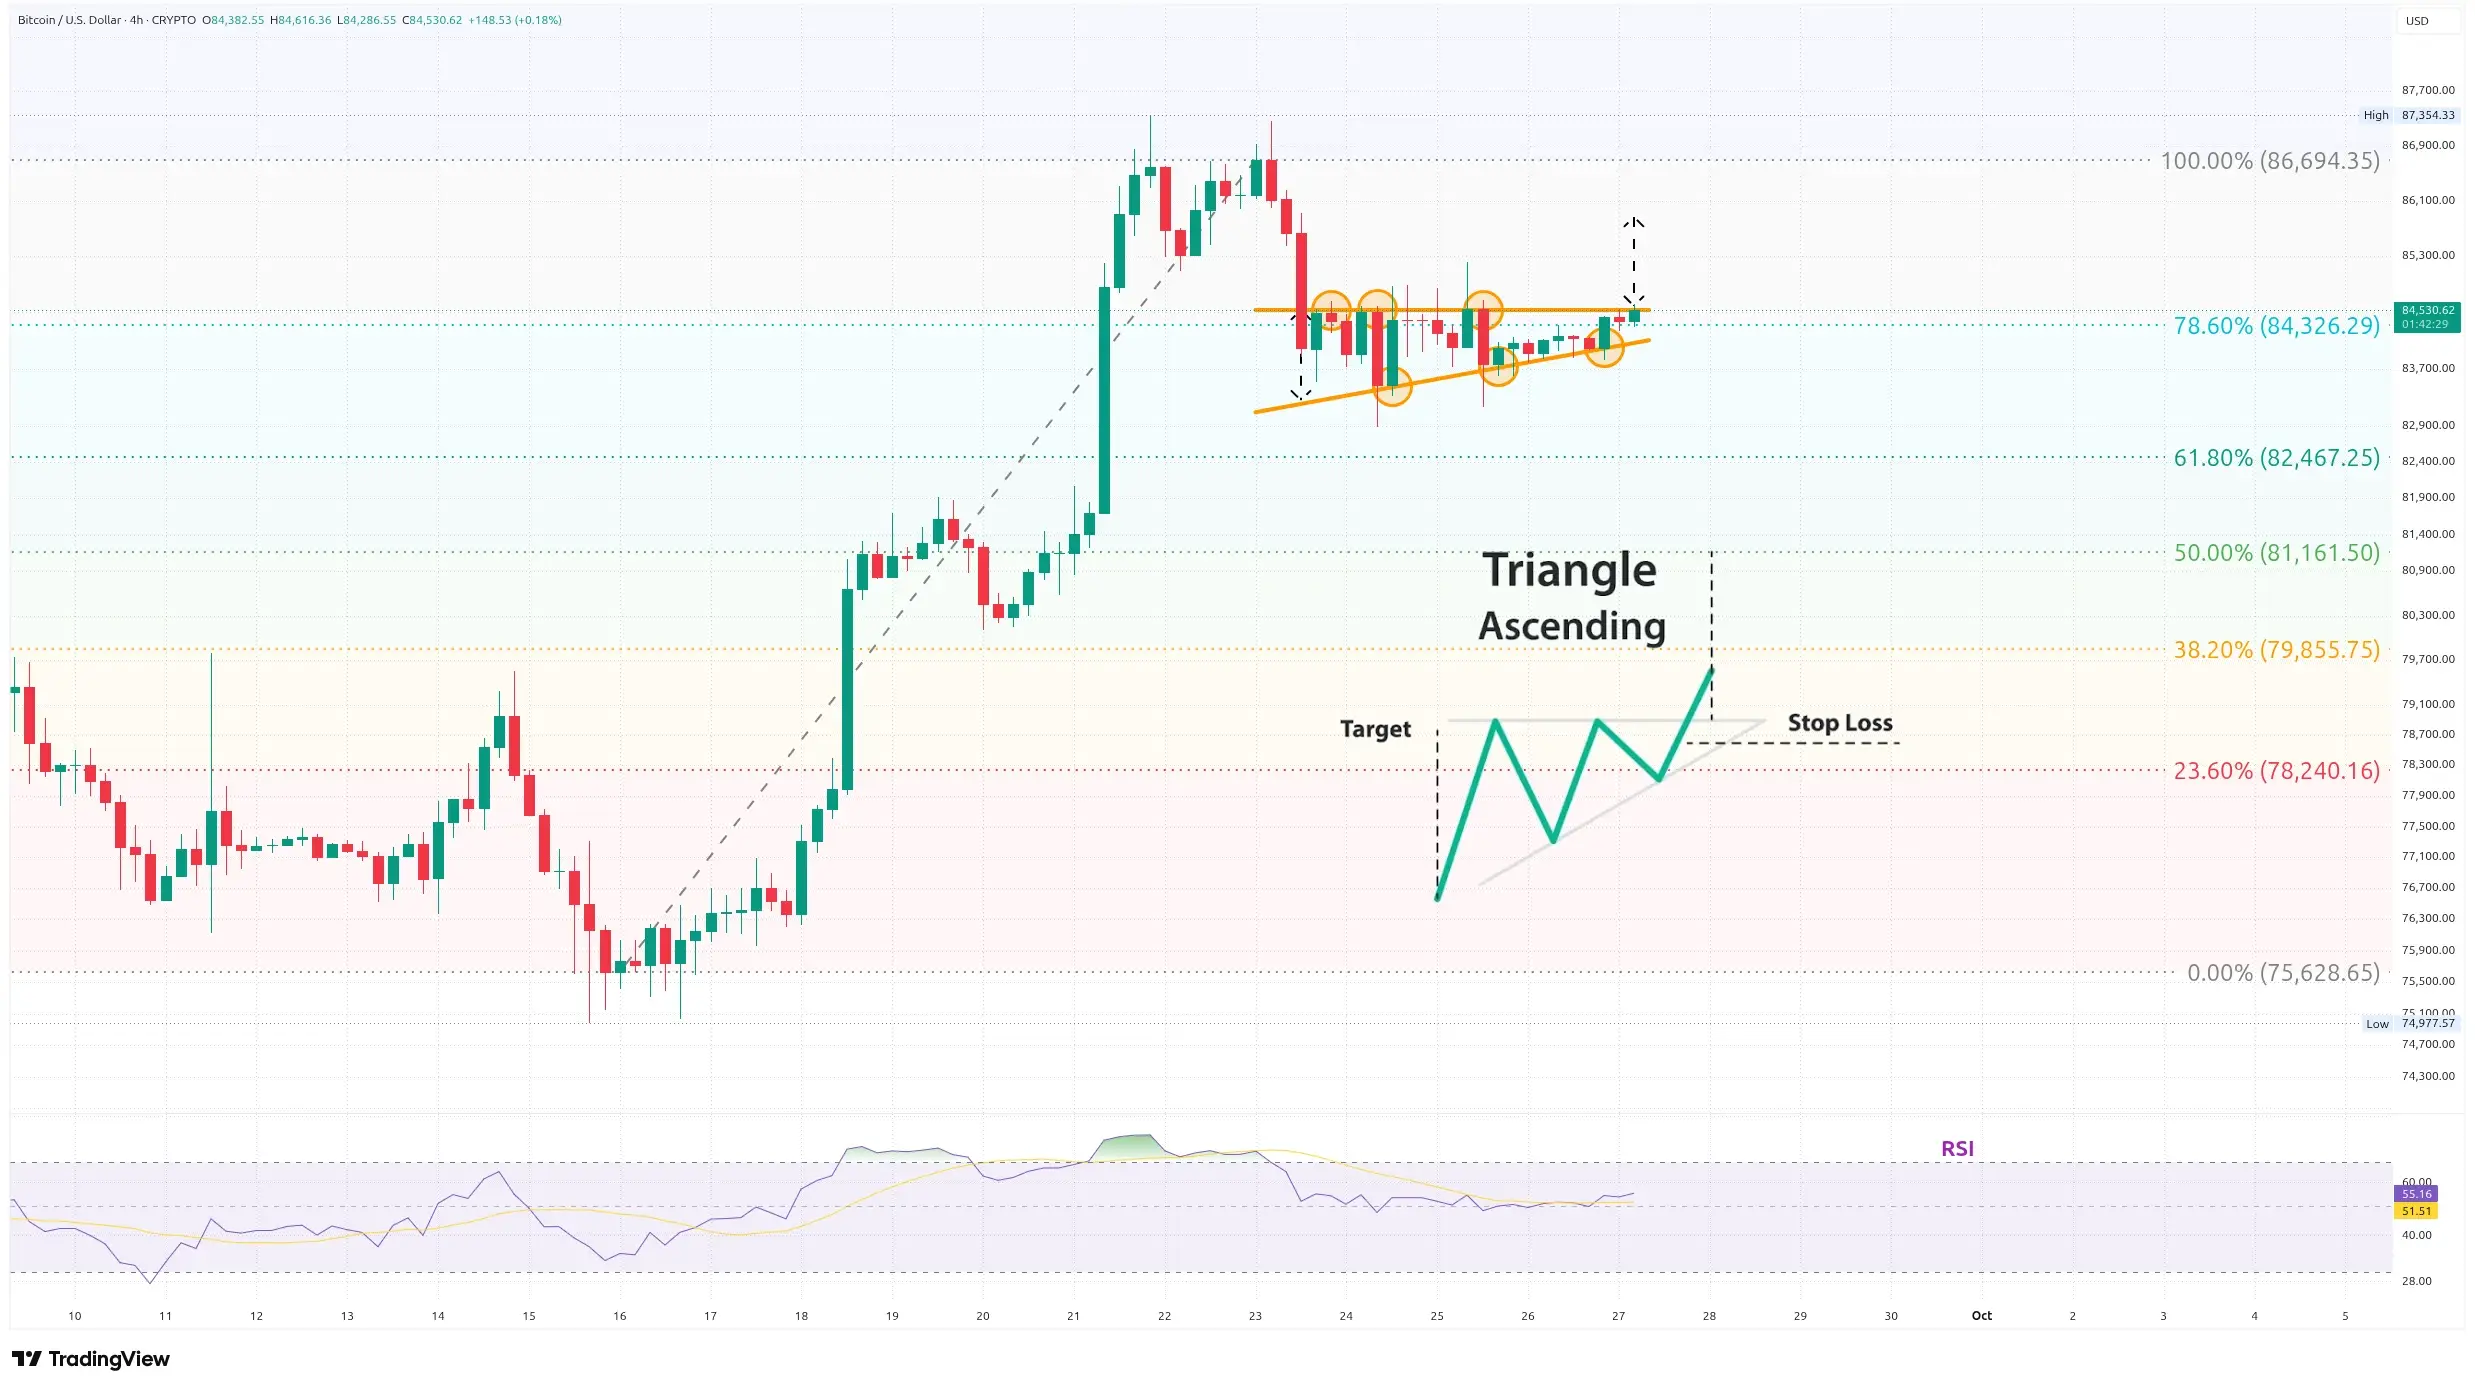
The four-hour chart shows Bitcoin moving largely sideways, a trend that has been in place since Wednesday. RSI is near 50, signaling indecision. Strong resistance sits above 84,500 USD, while support is gradually moving higher.
Both trend lines have already been tested three times. This creates a potential ascending triangle, which can act as a continuation pattern during an uptrend or a reversal pattern after a decline. In this case, a confirmed breakout could point toward approximately 85,800 USD.
The Fibonacci retracement also shows that the recent decline returned Bitcoin to the important 78.6% level. If the bullish structure fails, the next support levels I would watch are around 82,500 USD at the 61.8% retracement and 81,150 USD around the 50% level.
The Daily Chart Could Still Point Toward 70,000 USD
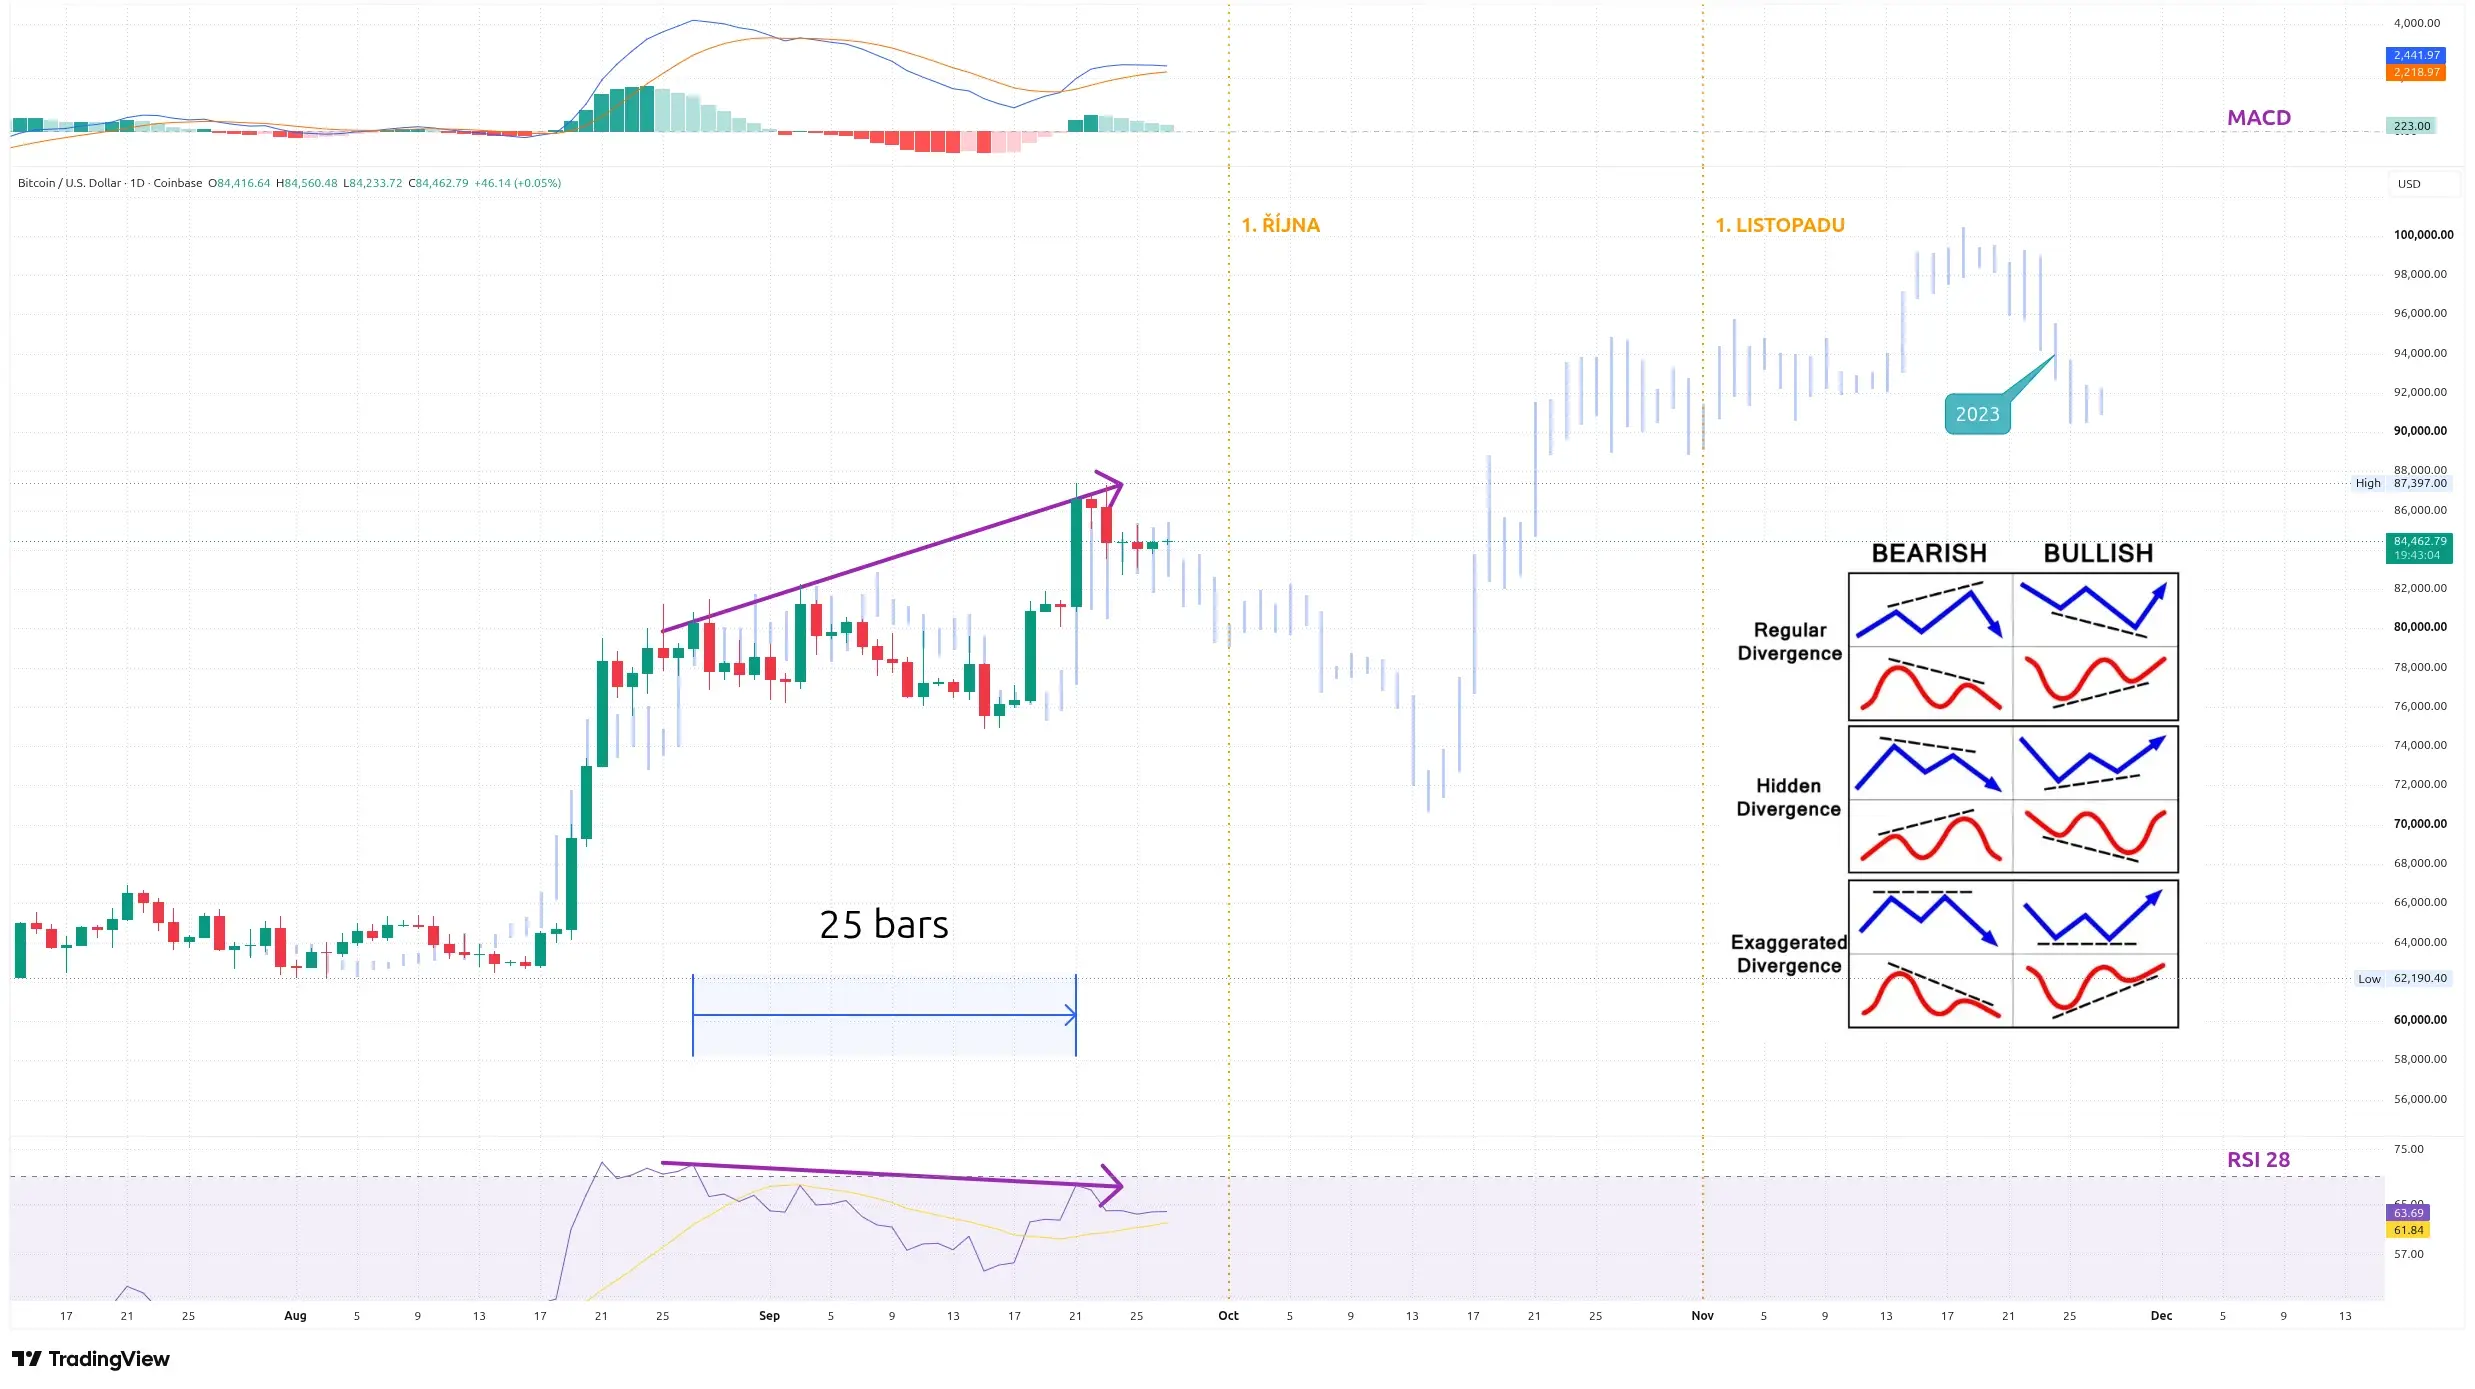
On the daily chart, I continue to compare the current structure with the early stage of the 2023 bull run. So far, the sequence of rallies and sideways periods remains surprisingly similar. History never repeats perfectly, but the comparison suggests that Bitcoin could continue drifting slightly lower through the end of September.
A more significant correction could then arrive around the middle of October. A purely historical analogy would put Bitcoin near 70,000 USD before a rebound. That would still allow October to finish with a gain of around 15%. This is only a historical comparison, however, not a forecast.
The current indicators also leave room for caution. RSI is forming lower highs while price has formed a higher high, creating a bearish divergence. MACD has also started flattening since Monday and may be approaching a bearish crossover.
Much will depend on the macro backdrop. If U.S. Treasury yields continue rising after the weekend, the probability of a deeper correction could increase.
Weekly Chart: History, the Present and What Could Come Next
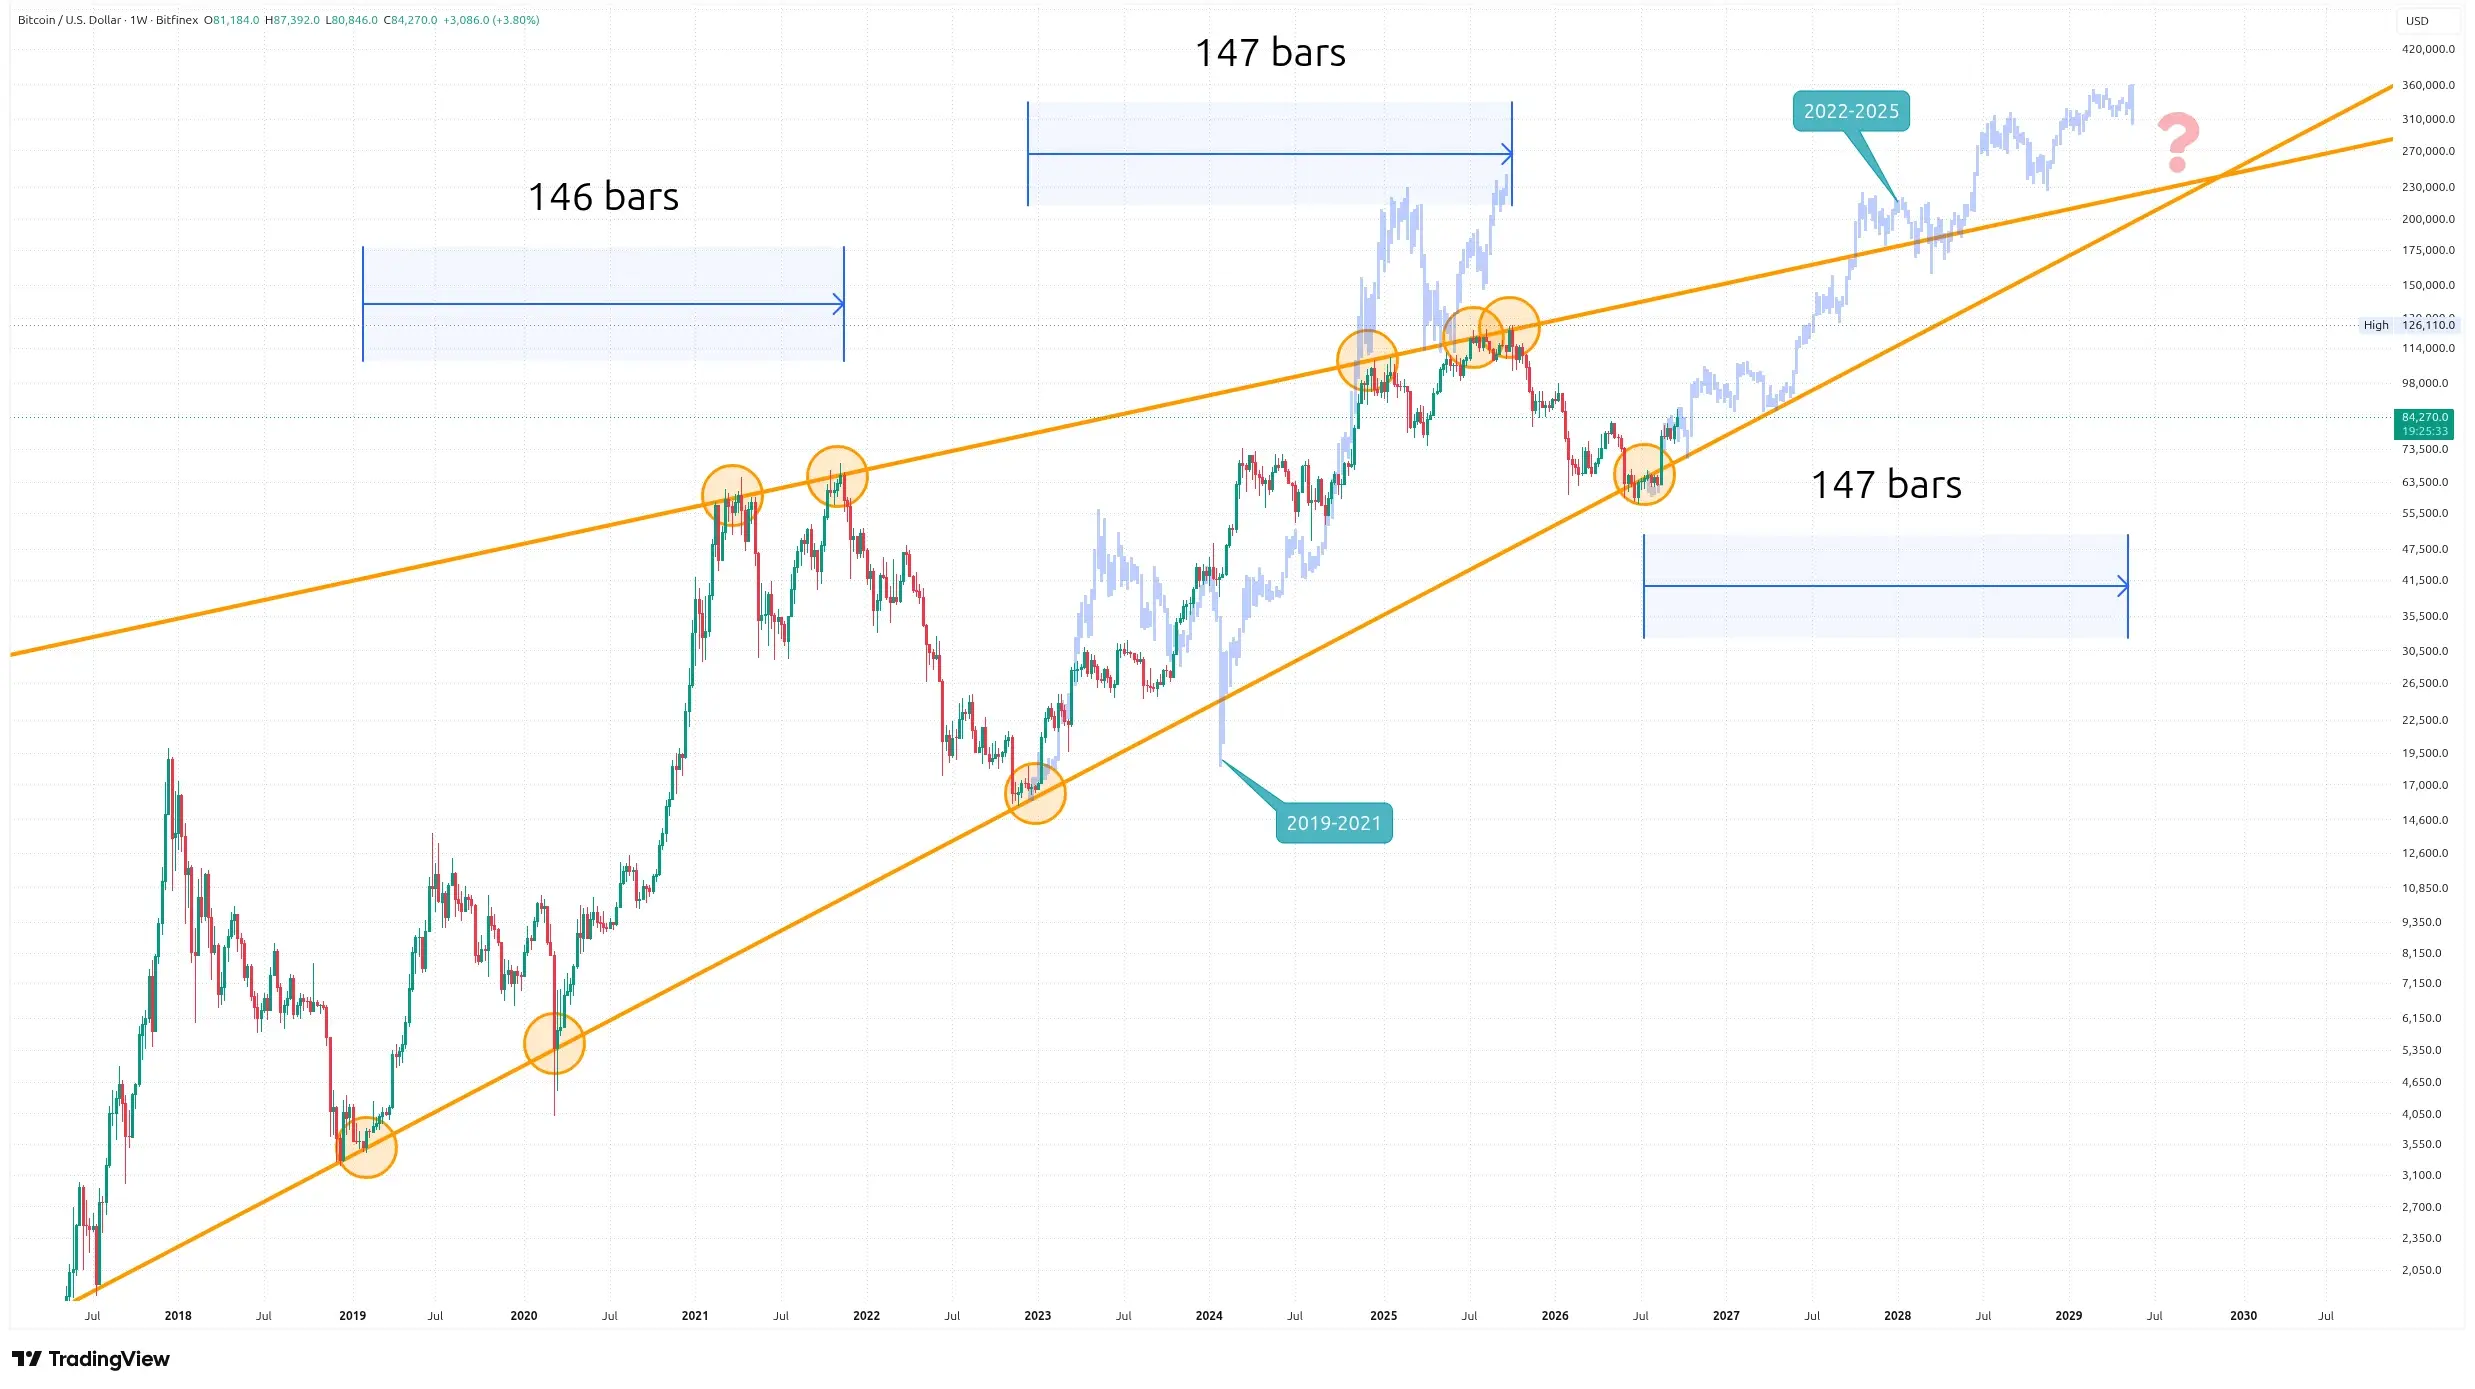
The weekly logarithmic chart contains two long-term trend lines that have repeatedly acted as support and resistance. They may help estimate the potential range of the next bull run.
The previous bull market lasted 147 weeks from bottom to peak. If those weekly candles are copied onto the current cycle, the early stage looks relatively similar. A simple repetition of history would eventually imply a move toward roughly 360,000 USD.
I do not consider that scenario especially realistic. Bitcoin’s volatility has gradually declined. When the 2019–2021 bull-market structure is applied to the previous cycle, the historical pattern would have implied a peak near 240,000 USD, while the actual top was around 126,000 USD. The arrival of large institutional investors and spot ETFs has brought more capital into the market, but it has also reduced volatility.
For that reason, I can more easily imagine a future peak around 140,000 USD, perhaps somewhat higher near 160,000 USD. This remains a personal estimate rather than a price target.
For now, the level I continue to watch is 82,154 USD, the high from early May. A weekly close above it would create a higher high and support the argument that the trend has changed. A close below it would leave room for another test of 80,000 USD or even 70,000 USD.
What Do Other Indicators Show?
Price charts are only one part of the analysis. I also follow on-chain indicators and other tools that can help describe market sentiment and potential pressure from different groups of holders.
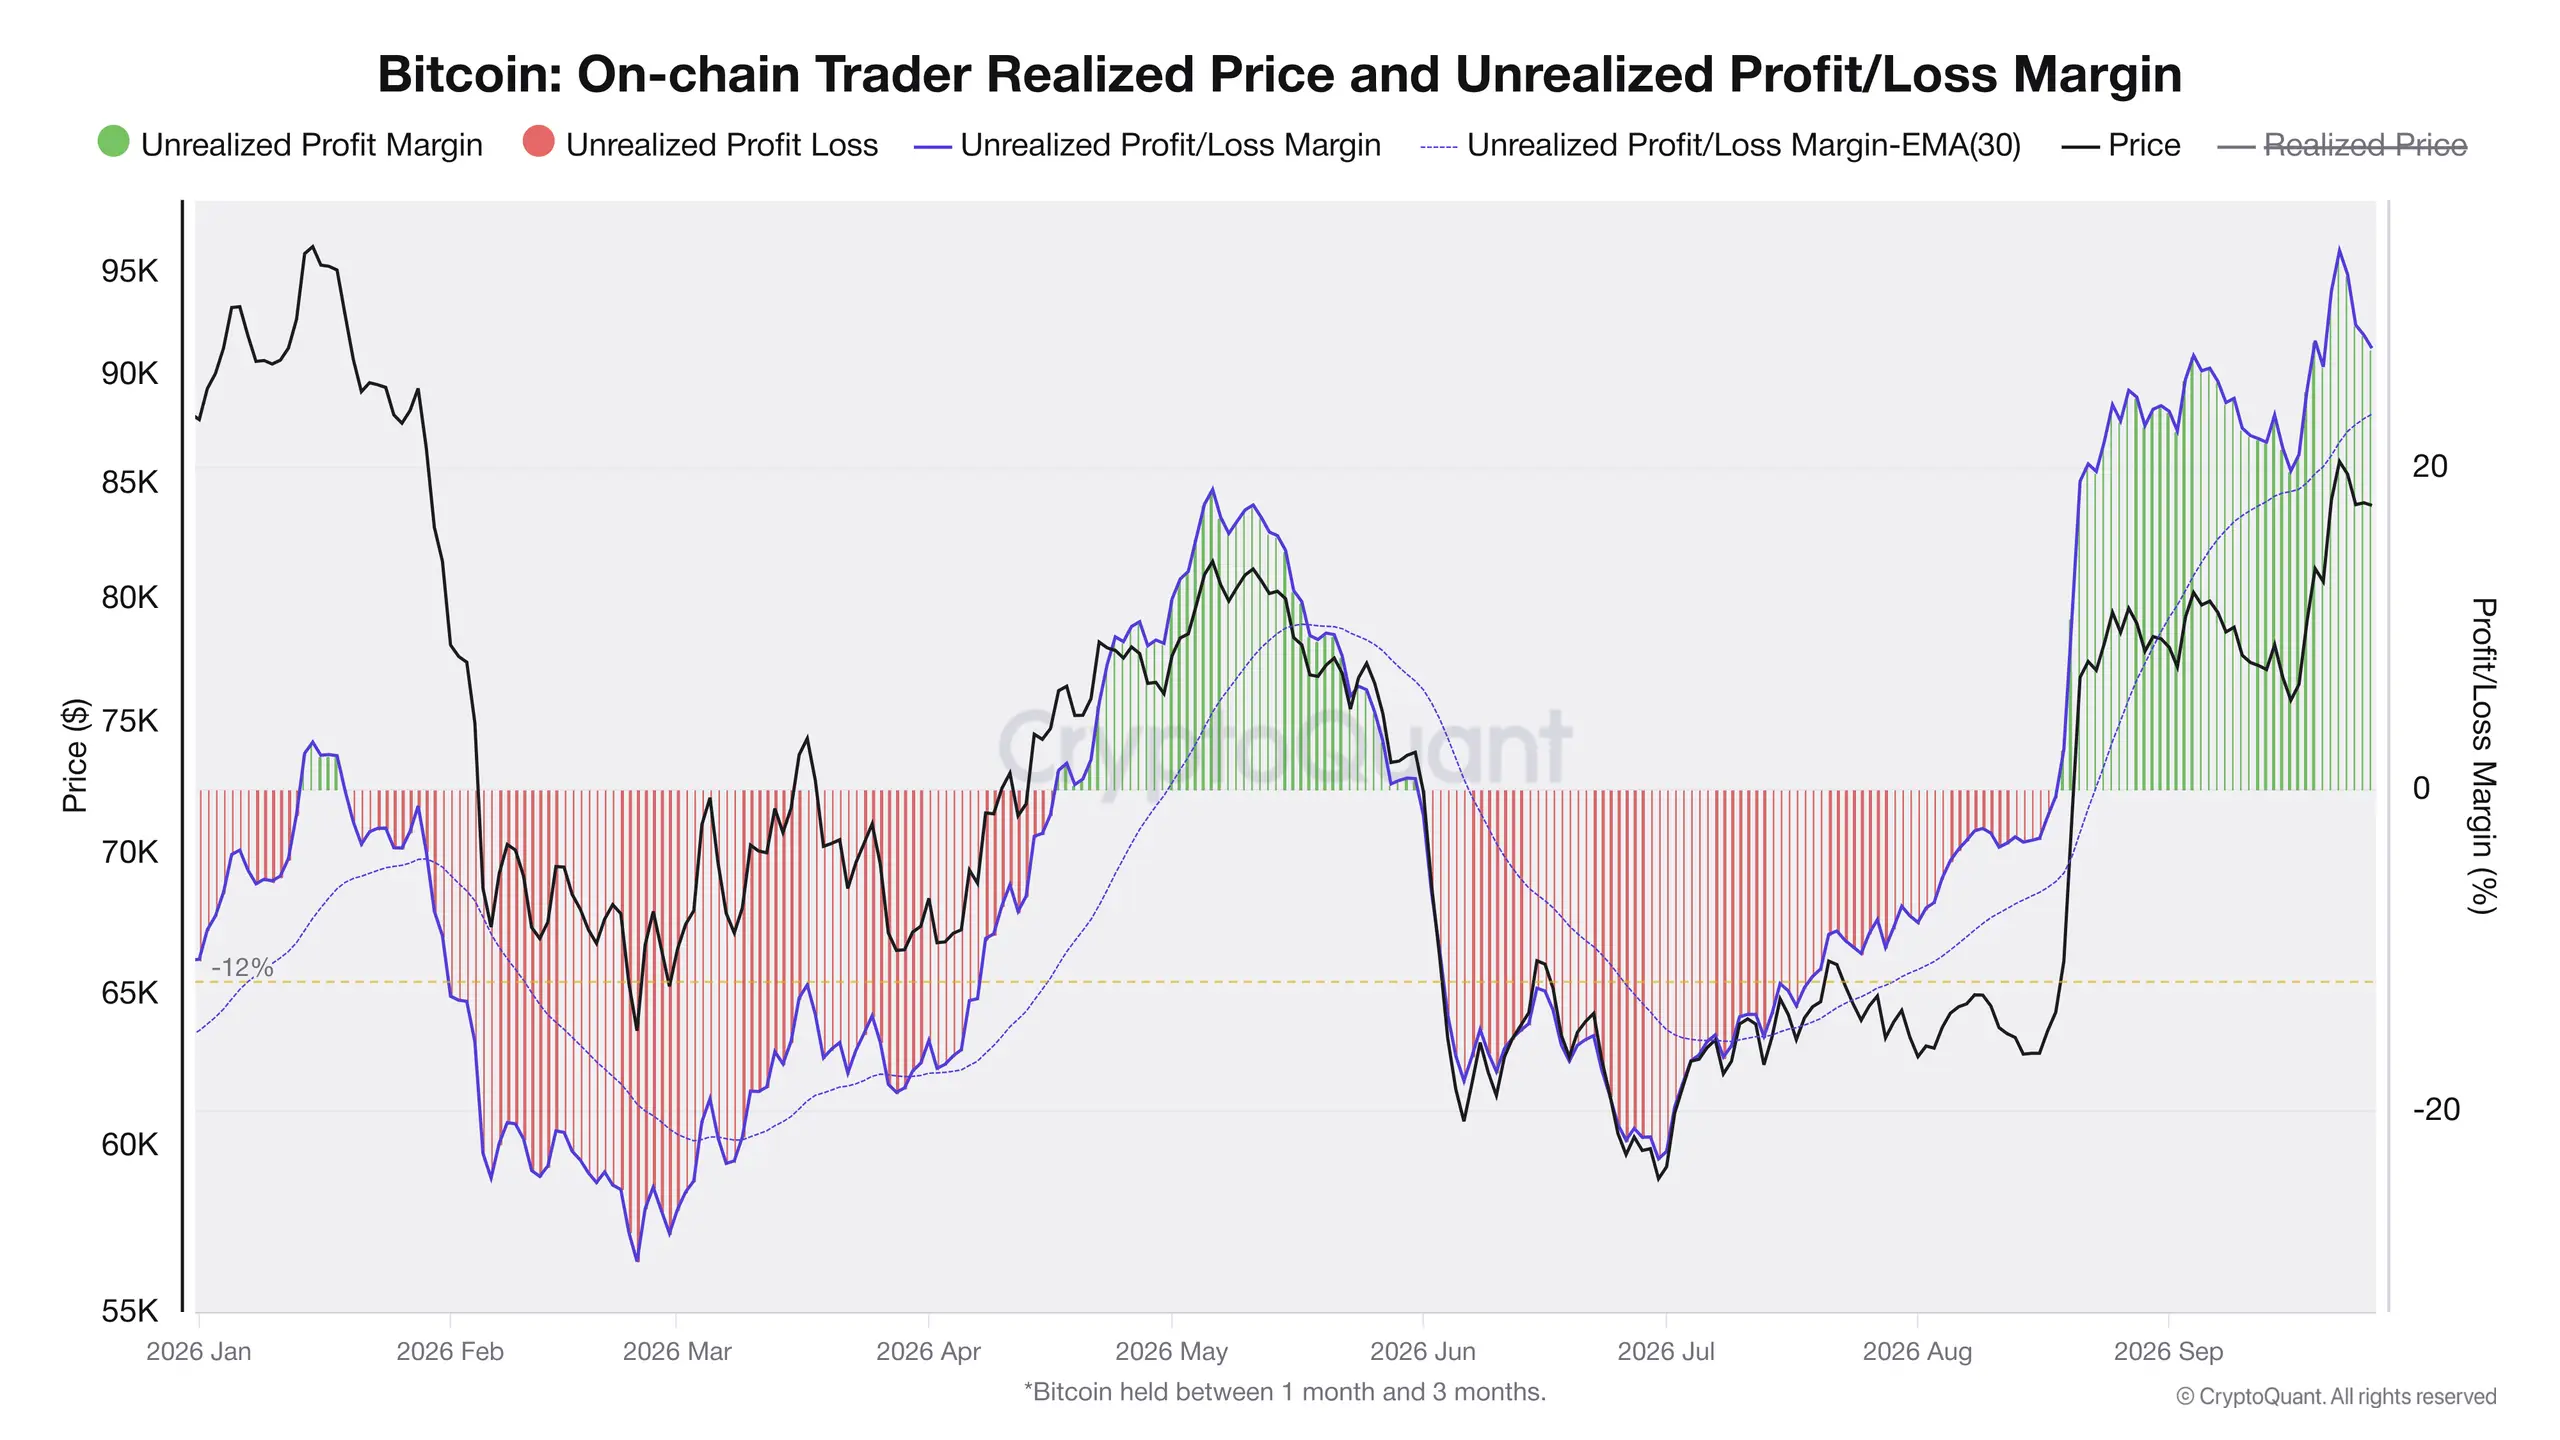
One of them is unrealized profit among short-term holders who have held Bitcoin for more than one month but less than three months. I exclude the shortest-term speculators and focus on a group that may be more willing to realize profits when the opportunity appears.
Their unrealized profit is currently at its highest level since the start of the year. That creates potential selling pressure. If the market begins to weaken, some of these holders may decide to lock in gains, which could accelerate a correction.
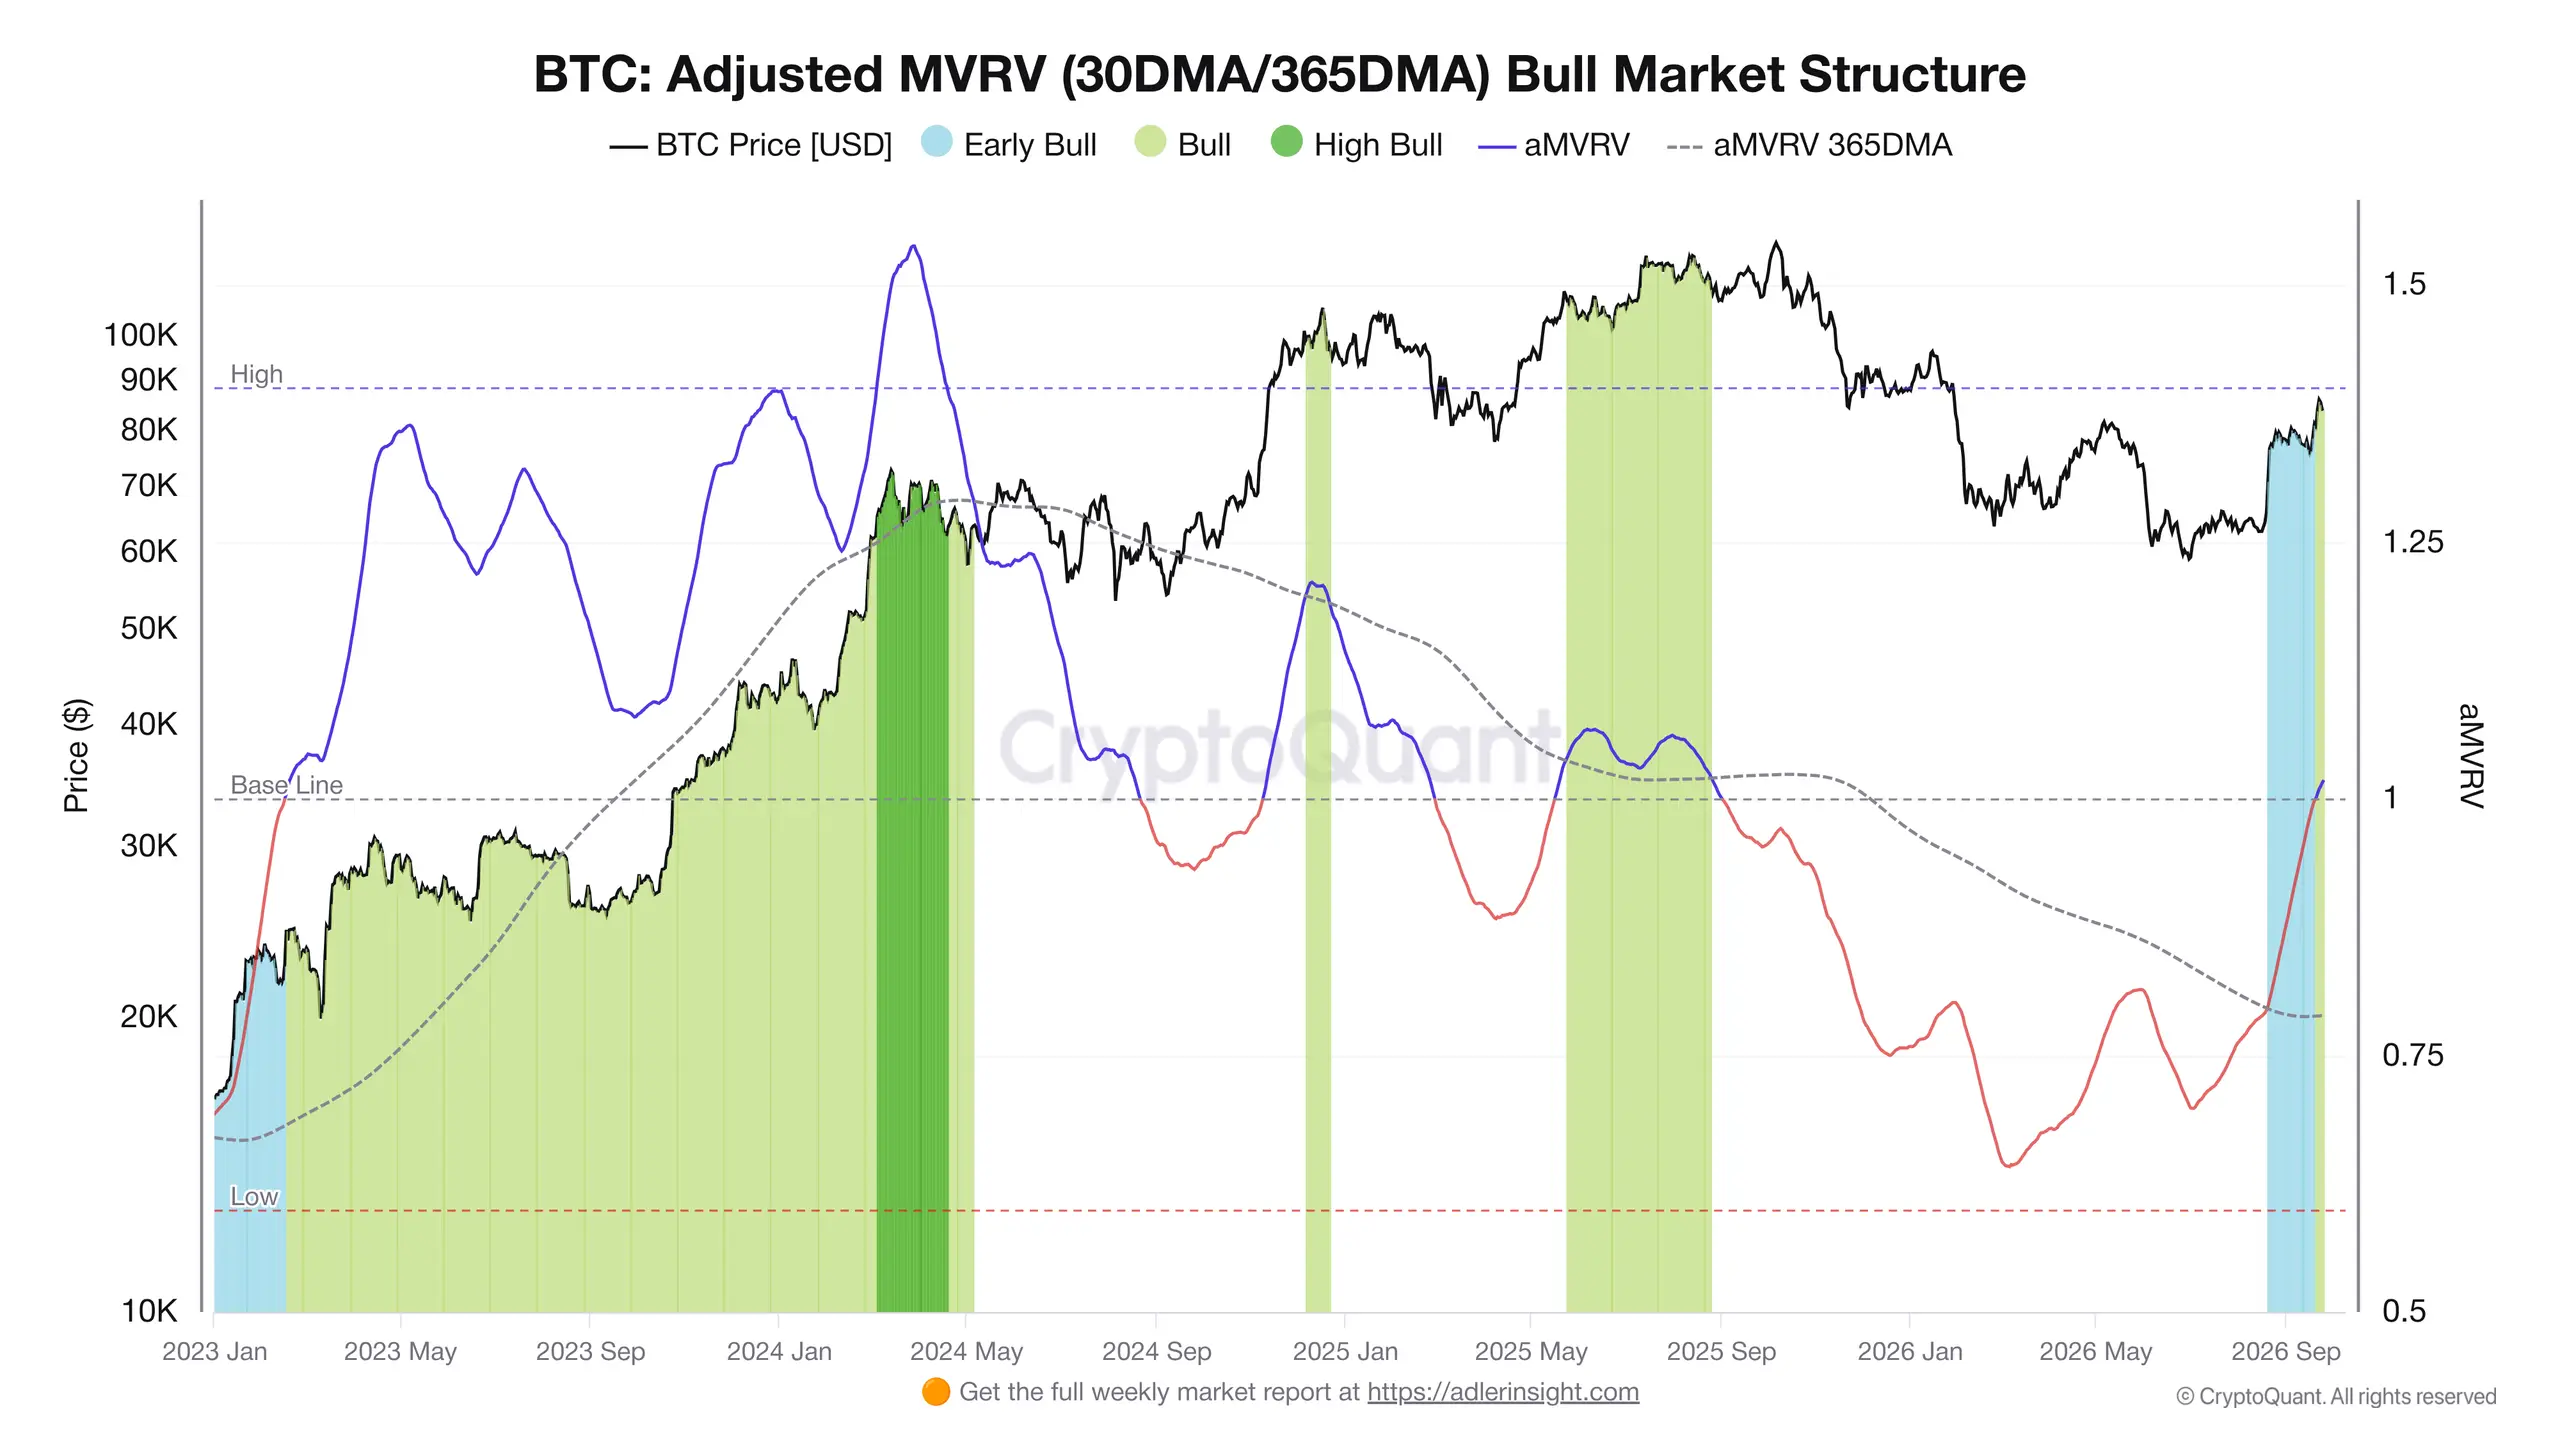
I also watch MVRV, or Market Value to Realized Value. CryptoQuant adjusts the indicator using logarithmic overbought and oversold levels and normalization, turning it into a more cyclical tool. The chart includes both 30-day and 365-day moving averages.
When the 30-day moving average crosses above the 365-day moving average, the model identifies an “Early Bull” phase. When the 30-day average rises above 1, it signals the start of a bull run. Based on this indicator, the bull market has already begun, with the current reading at 1.018.
Has the Bull Market Already Started?
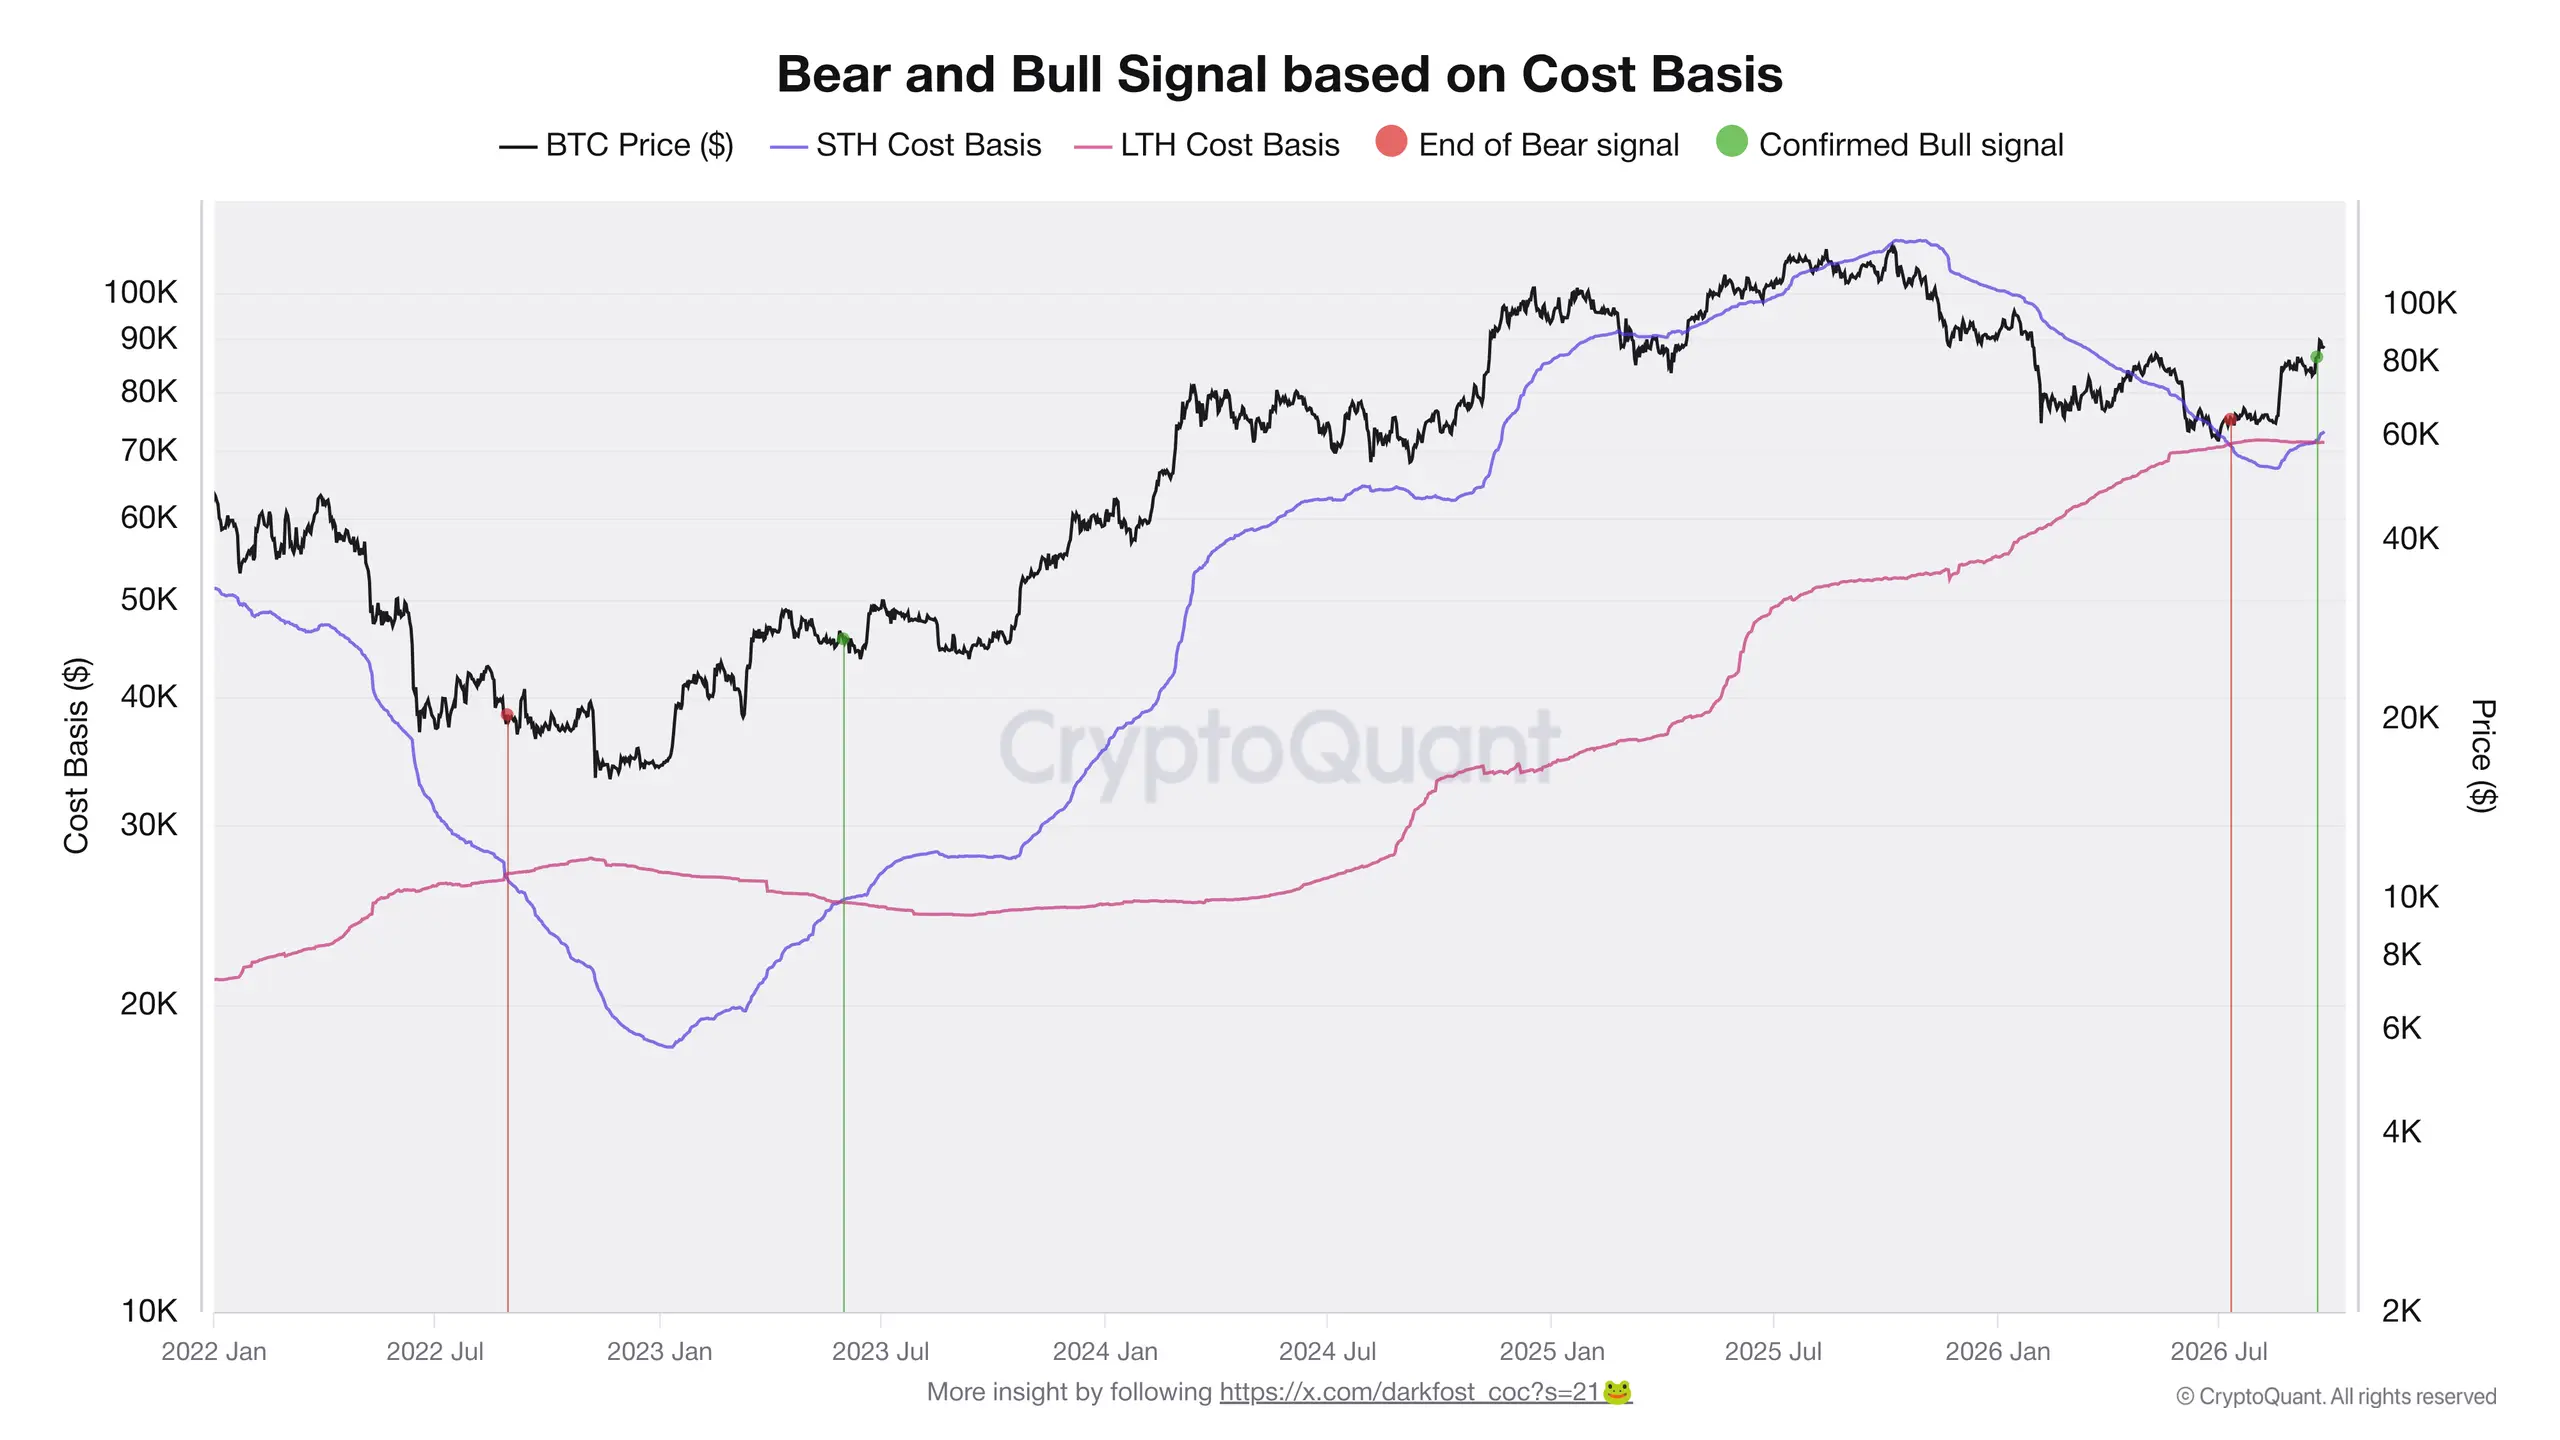
Another confirmation can be found in the average cost basis of short-term holders (STH, up to 155 days) and long-term holders (LTH, 155+ days). When the STH cost basis falls below the LTH cost basis, it can signal the end of a bearish cycle phase. A later crossover back above it can indicate the beginning of a bullish phase.
That pattern worked in the previous cycle, and it appears to be developing again now.
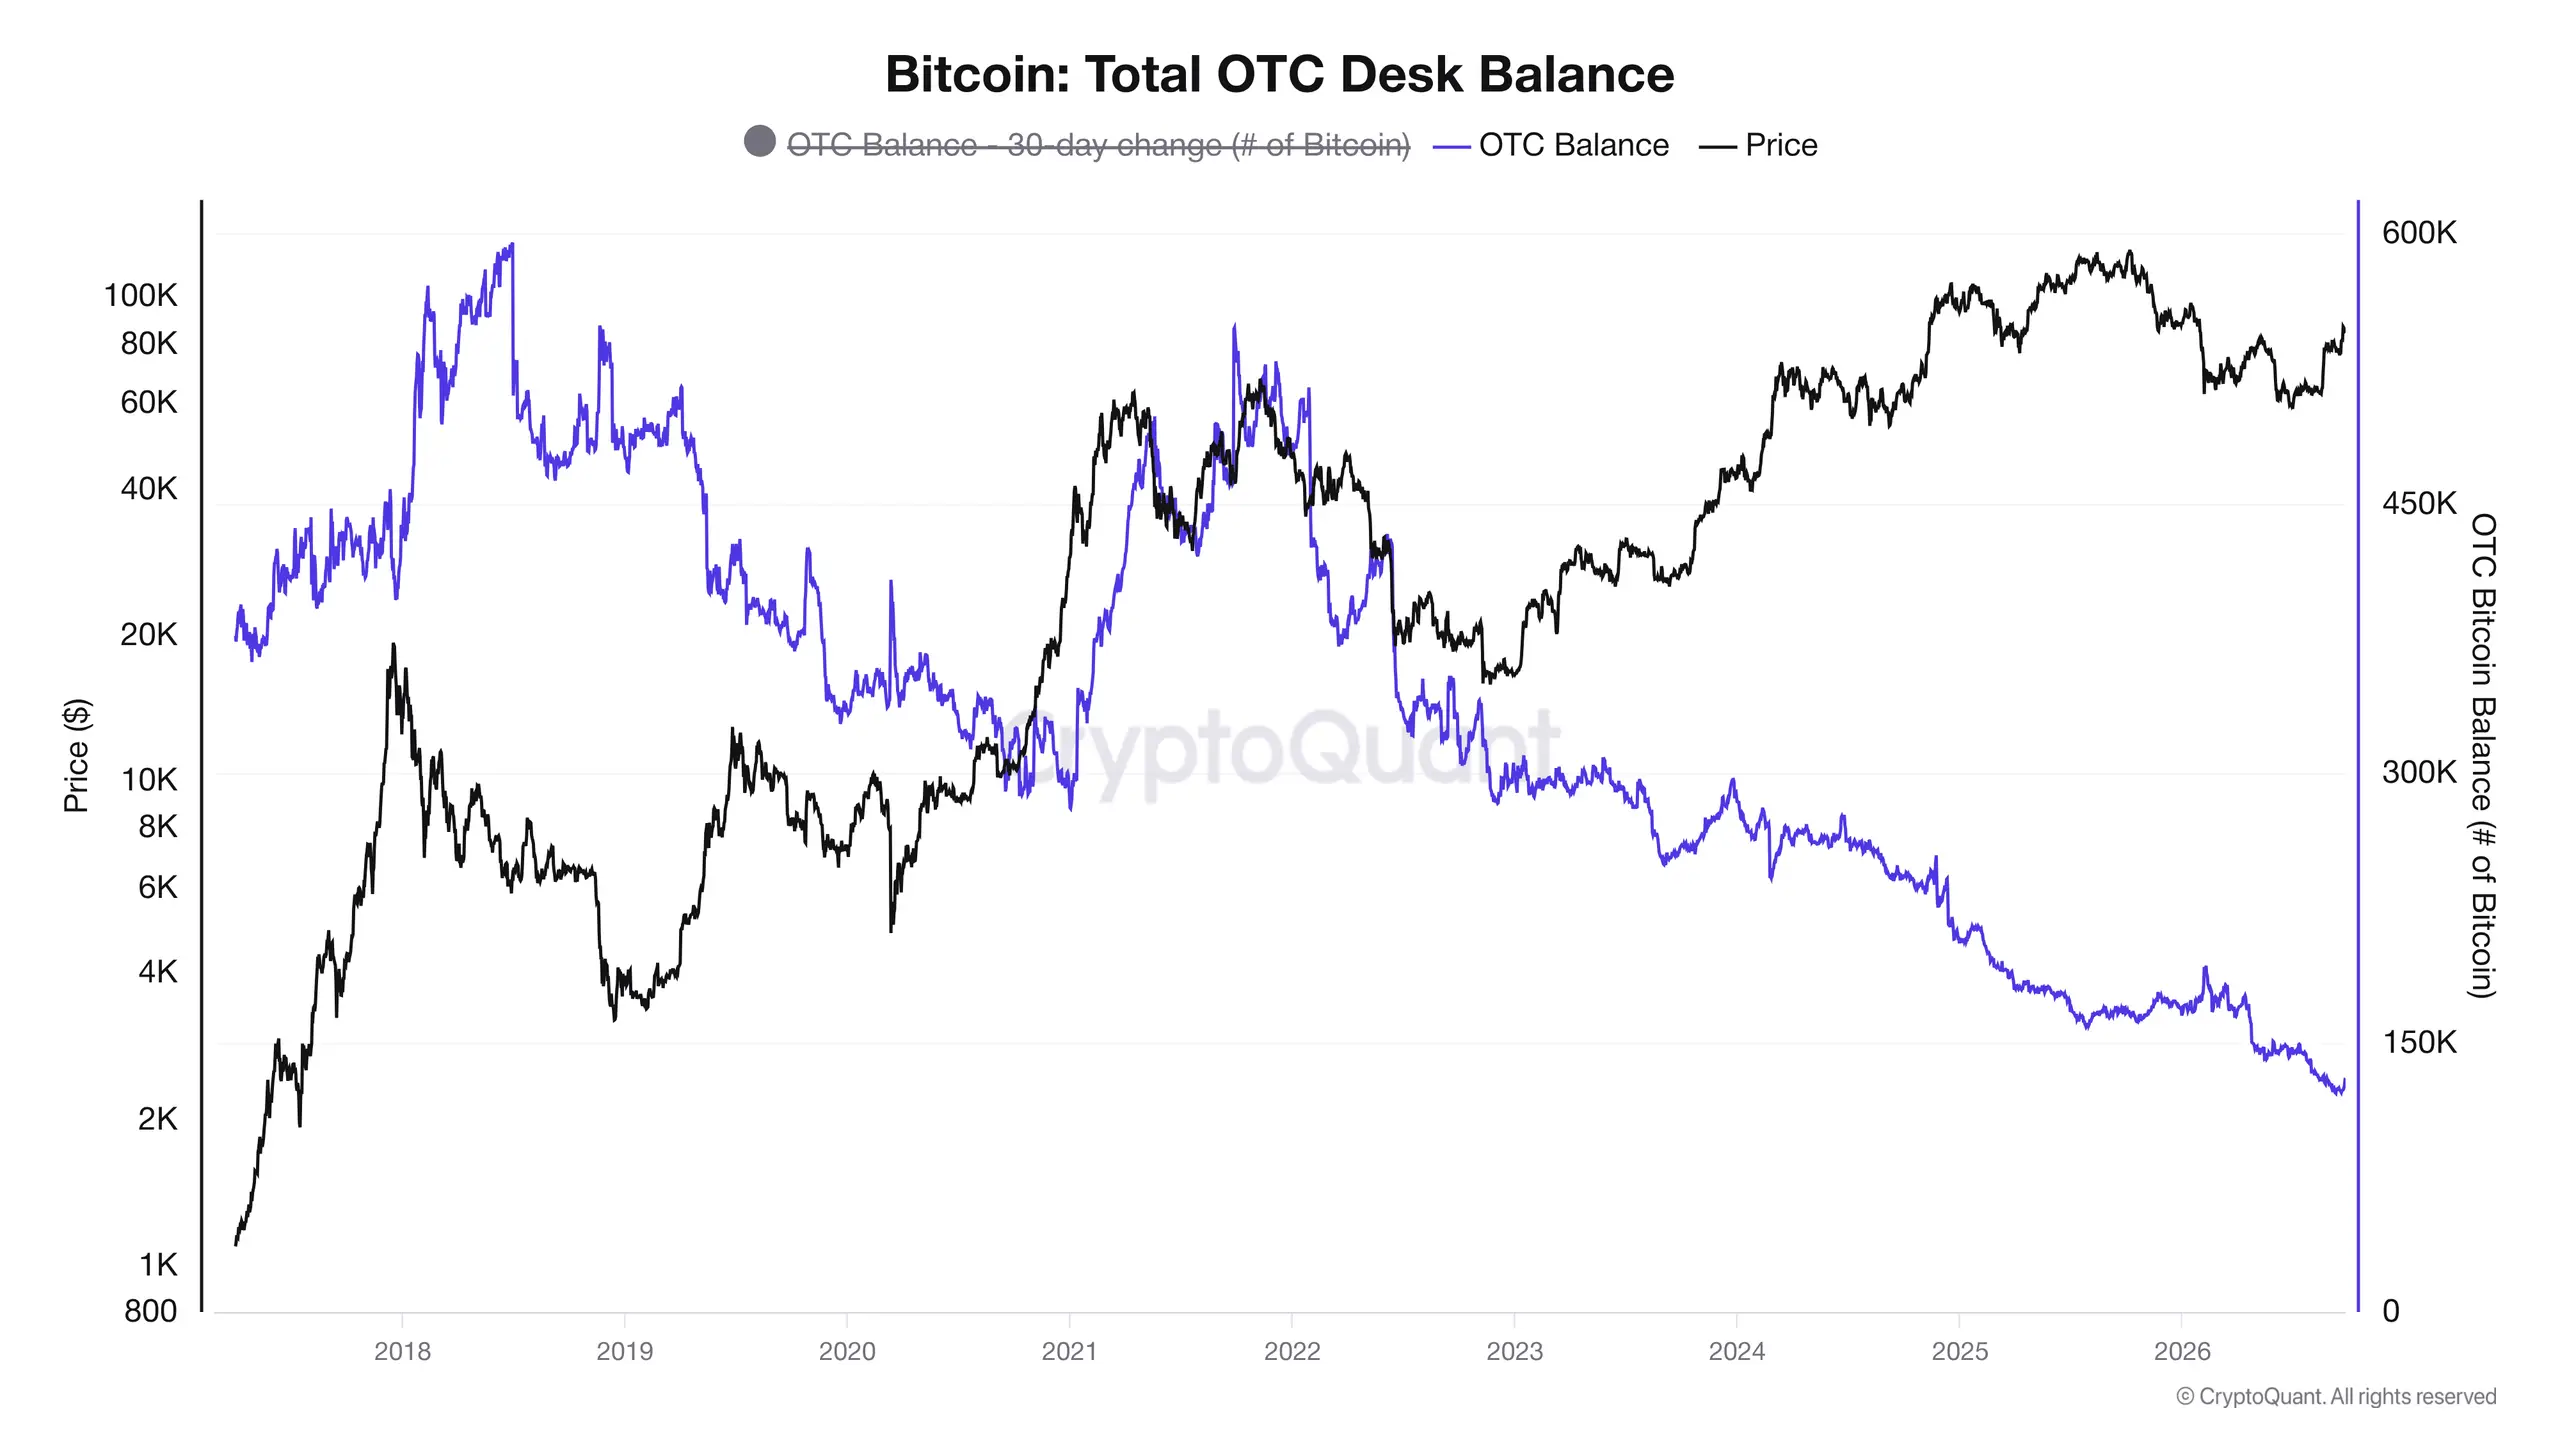
I am also watching the amount of Bitcoin available for sale through over-the-counter markets. Spot ETFs generally do not buy primarily on exchanges but through OTC channels. Around 130,000 BTC are currently available there, worth approximately 10.9 billion USD at current prices.
Spot ETFs added around 2.39 billion USD this week. If that pace continued, the existing OTC supply would not last many weeks. Funds could then be forced to buy directly from miners or on traditional exchanges, potentially creating a stronger sense of scarcity and upward pressure on price.
What Could Happen Next Week?
Technical analysis can improve the probability of a successful trade, but macroeconomics continues to dominate the broader market. Next week will again bring several important U.S. releases.
On Tuesday at 16:00, the United States will publish the JOLTS report for August. Markets expect little change in job openings. A stronger reading could be negative for risk assets because a resilient labor market would give the Federal Reserve more room to raise rates.
Wednesday will bring another important set of figures at 14:30, including the PCE price index, GDP data and personal income and spending. PCE remains one of the Fed’s preferred inflation measures, so any surprise could influence rate expectations.
The manufacturing purchasing managers’ index follows on Thursday at 16:00. A reading above 50 indicates expansion, while below 50 signals contraction. Analysts expect 54.8, slightly above the previous 54.6.
Friday at 14:30 will bring unemployment data and nonfarm payrolls. Markets currently expect unemployment to rise slightly. Any meaningful deviation could again trigger volatility.
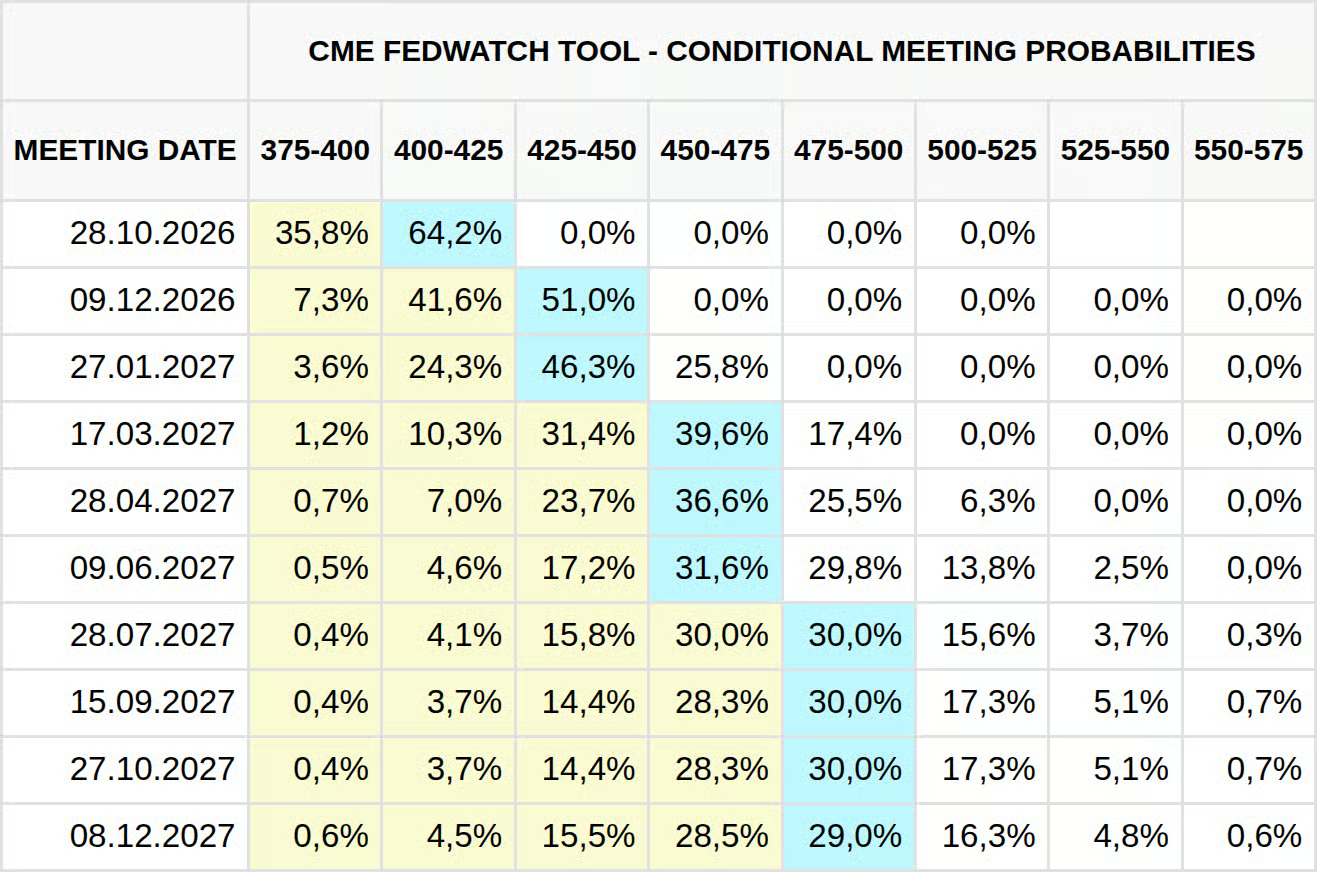
Traders are currently pricing in four additional rate hikes — two this year and another two by next summer. A deterioration in those expectations could hurt Bitcoin, while a more favorable rate outlook could support it.
What Should We Watch Next Week?
Not all important events are scheduled. The meeting between the U.S. and Chinese presidents ended on Friday without a major trade agreement, but with what is essentially an extension of the current truce. The arrangement, previously due to expire in early November, has been extended until January 10, 2027.
This agreement also includes tariff reductions on selected goods worth 30 billion USD on each side and a mechanism designed to address trade barriers. China also reportedly committed to purchasing 10 million tonnes of coal in each of the next two years.
Markets have not yet had much opportunity to fully price in the outcome, including expectations that were not met. From Bitcoin’s perspective, however, the lack of a new confrontation could reduce uncertainty and support risk assets.
The Strait of Hormuz remains another major variable. Reports suggest Iran has been attacking tankers, while some vessels have turned around or avoided entering the strait. Any prolonged disruption could continue pushing oil prices higher.
A significant number of aerial refueling aircraft have also been operating near the region. Similar activity was observed the previous Sunday shortly before Trump canceled a planned attack. It may be strategic signaling, the situation may de-escalate again, or an actual strike could still occur. The market therefore has to account for all three possibilities.
How Could Bitcoin Develop From Here?
The hourly chart shows a relatively calm weekend and a mild recovery since Saturday evening. That has brought Bitcoin back toward the upper trend line of the four-hour structure. A breakout could confirm the bullish pattern and open the way toward approximately 85,800 USD.
Such a move would also increase the probability of a weekly close above 82,154 USD, creating a higher high and strengthening the case for a new bullish phase. At the same time, short-term holders are sitting on substantial unrealized profits, so even a small bearish signal could trigger profit-taking and a sharper decline.
Most of the indicators I follow are already pointing toward a bull market, and I also believe the cycle bottom has probably been established. Still, the risk of an unexpected shock should not be ignored. In 2022, the market structure also appeared constructive before the collapse of FTX quickly pushed Bitcoin to a new low.
There is already no shortage of negative macro headlines. Traders expect four further rate hikes, the oil crisis is escalating, and investment in AI data centers is creating additional pressure in bond markets. Large technology companies have issued roughly 200 billion USD in bonds this year, compared with about 80 billion USD in all of 2025, increasing competition for capital.
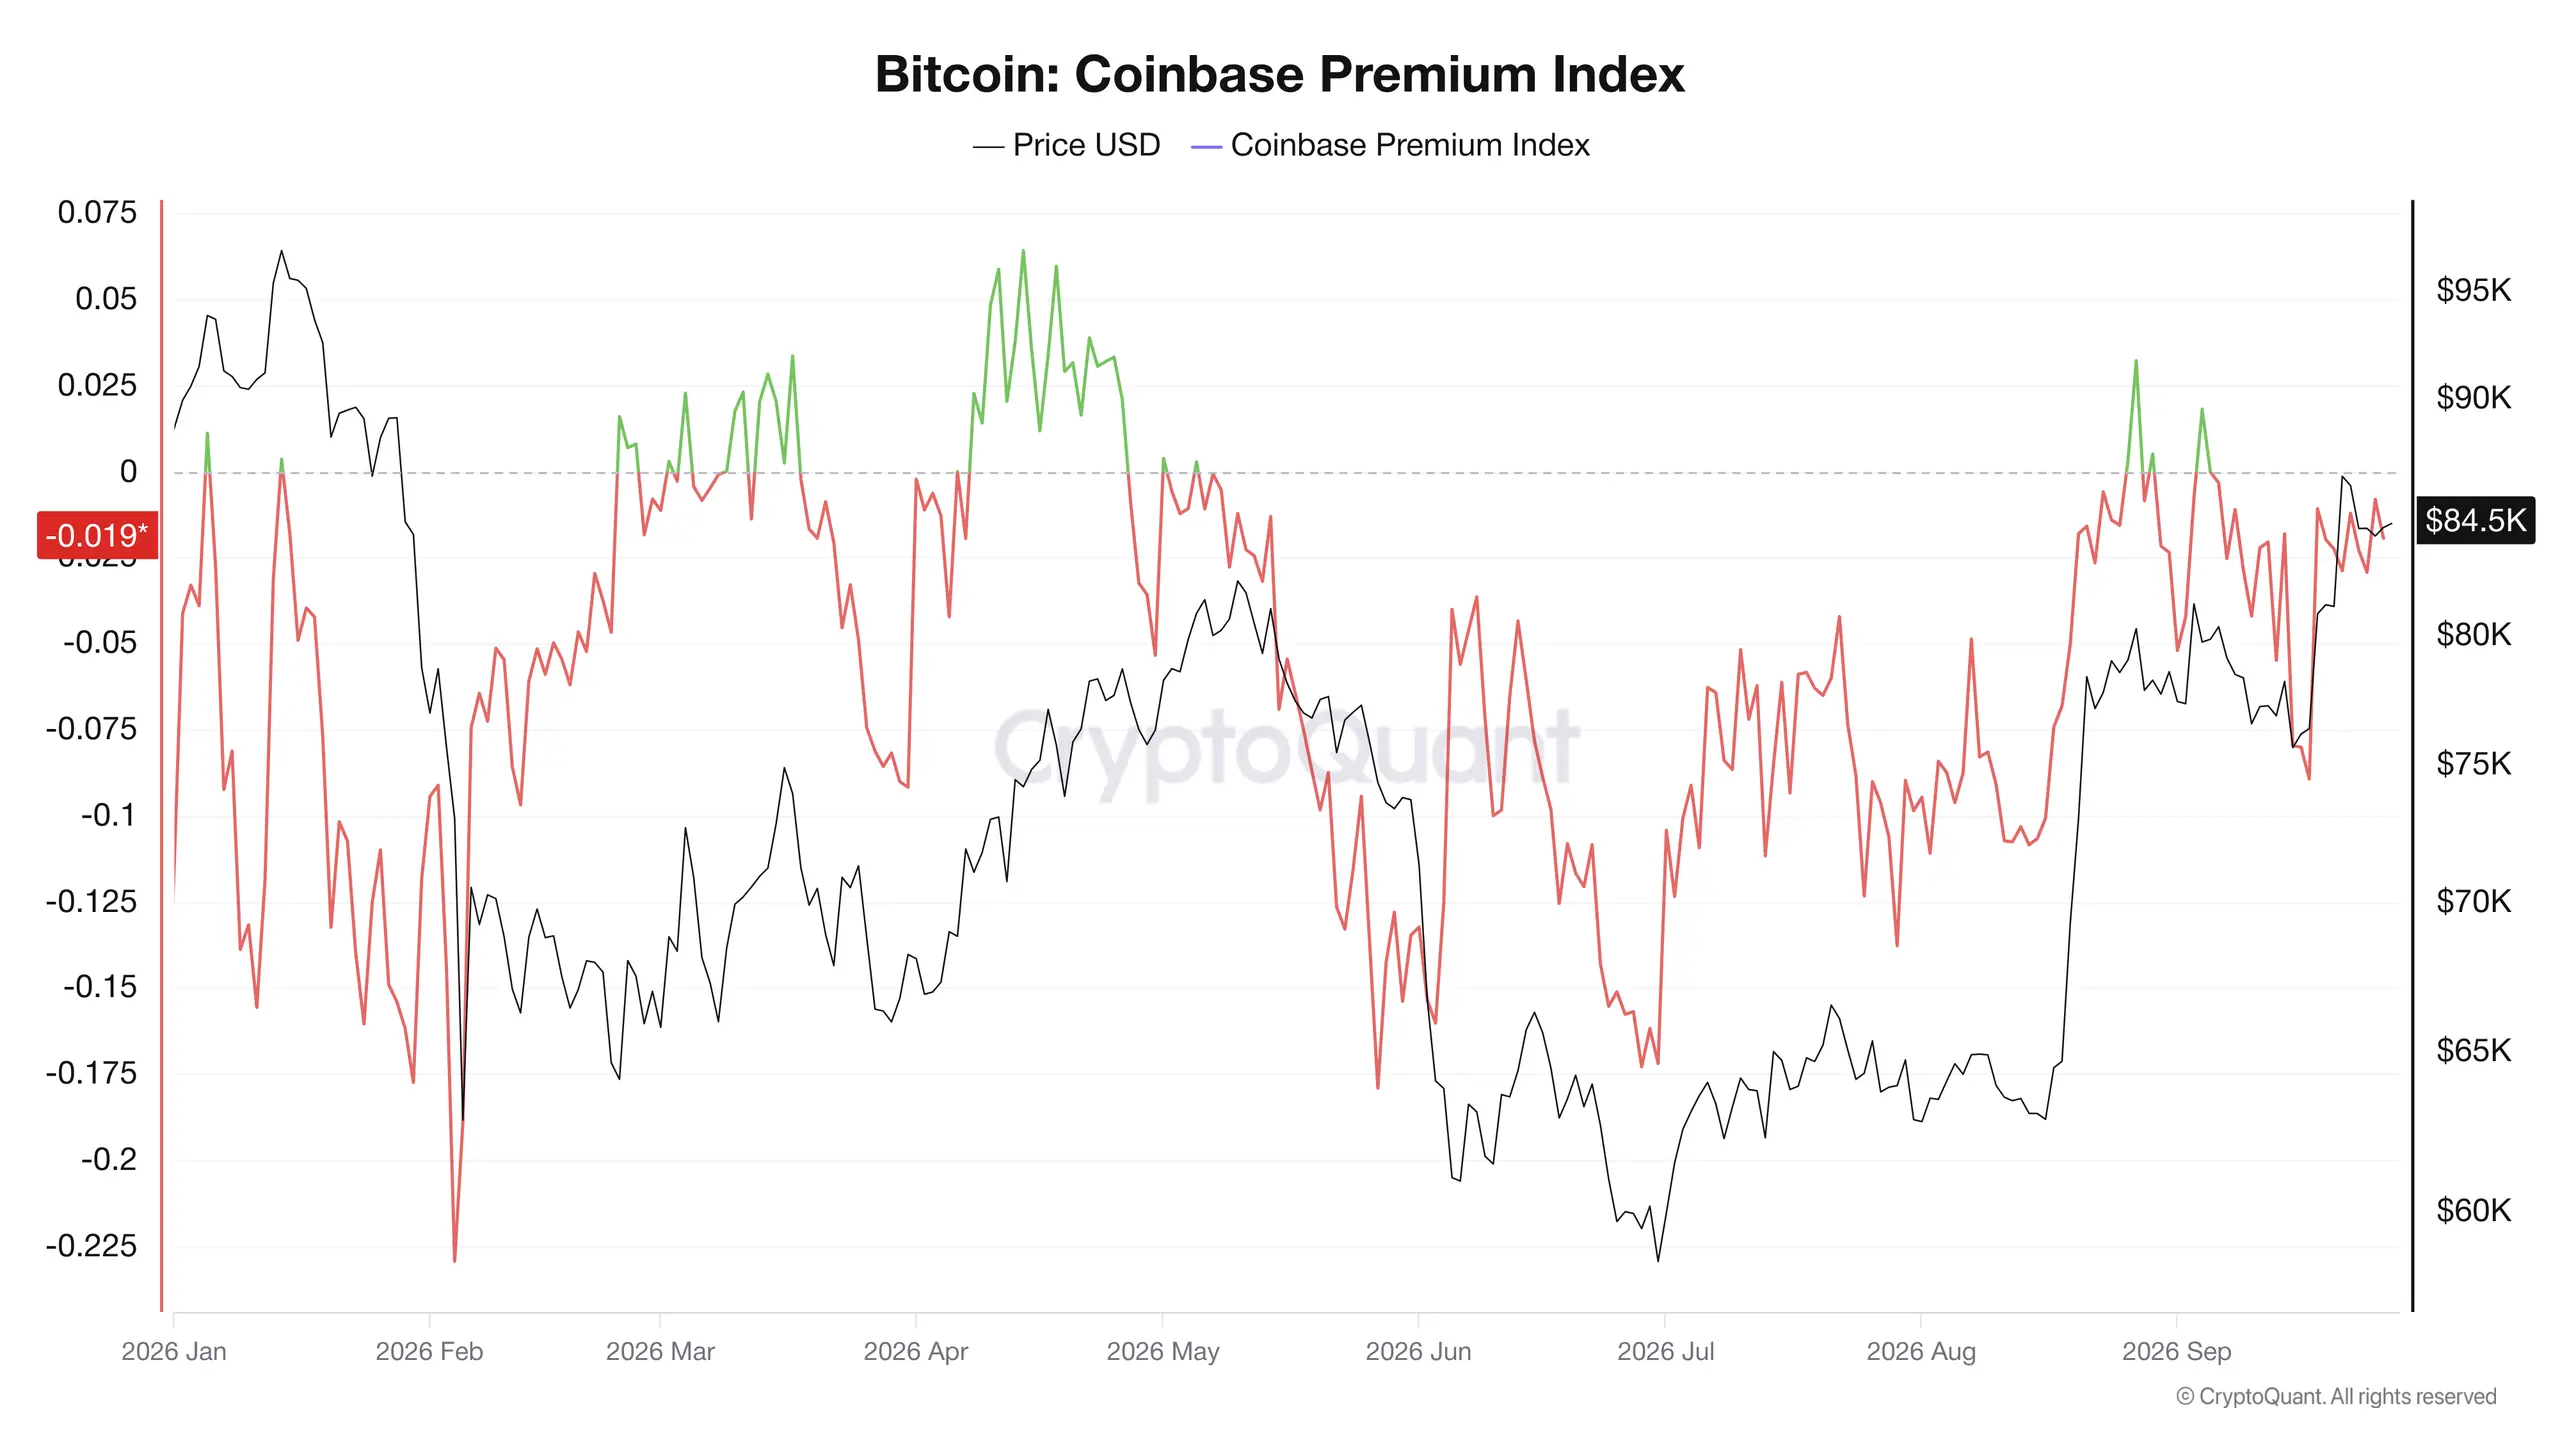
Against that backdrop, Bitcoin has held up relatively well. Renewed demand is currently most visible in spot ETFs, while the Coinbase Premium Index and Korea Premium Index remain close to zero.